The National Association of Home Builders (NAHB) Housing Market Index (HMI) was unchanged in February, holding at 16 for the fourth month in a row. The index is a “magic 50” index, where 50 is the dividing line between homebuilders seeing the conditions as been good and being poor. As such, 16 is an extremely weak reading.
The index is made up of three sub-indexes. The index tracking current sales improved by 2 points, but that only brought it up to a level of 17. The index that tracks sales expectations over the next six months rose by one point, to 25, while the index that tracks the traffic of potential homebuyers in the model homes was unchanged at 12.
If you want to hunt real hard for a silver lining, these numbers suggest that there was a little bit of improvement, but not enough to really make a difference. The HMI has been below the 50 line since the spring of 2006.
By Region
Regionally, the Northeast (the smallest of the four census regions when it comes to new home data) increased 2 points to 22. The South, the largest (and thus most important) region, increased by one point to 18. On the other hand, the Midwest fell 1 point to 12, and the West was off two points to 13.
Lousy readings in all four regions, but truly awful ones in the West and Midwest, and getting worse there. This report was not a disappointment, as it came in line with expectations, but it is a reminder that the housing market is not showing much in the way of improvement.
A Leading Indicator
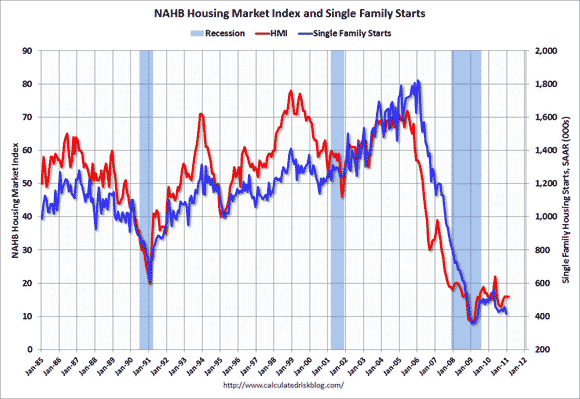
As the graph below (from this source) shows, it’s a leading/coincident indicator of housing starts (single family only shown on the chart; the rest of the discussion focuses on total starts).
Housing starts have been extremely depressed — not just relative to the bubble peaks, but in absolute terms. The weakness in residential investment was one of the things that caused the recession, and the lack of rebound there has been one of the key reasons why the recovery has been so sluggish and has not created the sort of job growth that one normally sees after a deep recession ends.
Every house built represents an enormous amount of economic activity and job creation potential. It’s not just the carpenter that is working directly for Lennar (LEN), or actually most likely a subcontractor, on actually building the house on site.
Building a house also includes using a lot of building materials, and so new home construction generates manufacturing jobs at firms like Fortune Brands (FO) which makes plumbing fixtures and kitchen cabinets. There are also the spillover effects of the roofers having jobs, meaning more money in their pockets, so they spend more money at Wal-Mart (WMT).
Housing Starts on Wednesday
We will get the data on housing starts (and building permits) tomorrow. The consensus expectation is for a small increase to a seasonally adjusted annual rate of 540,000 for starts, but for permits to dip to an annual rate of just 580,000.
Just to put those numbers in perspective, the bubble highs were at 2.273 million (1/06) and for permits at 2.263 million (10/05). While there is no consensus estimate for the single-family-only starts, they were at just 417,000, down from a peak of 1.823 million (1/06).
OK, perhaps it is not fair just to compare the levels to what were in hindsight ridiculously high bubble levels. Still, over the last 40 years, the average level of total starts has been 1.501 million, while the average level of single family starts has been 1.066 million. Thus in December, total starts were 76.2% below peak levels, and 64.0% below long-term average levels.
For single family starts (which tend to be more stable than multi-family starts, which can be extremely volatile from month to month) we were 77.1% below peak, and 60.9% below 40-year average levels. That is despite substantial population growth over the last 40 years.
Working Off Inventory
The silver lining to the low level of starts is it means that we are not adding a lot of housing supply. That is a very good thing in light of the existing glut of housing inventory. The inventory is all on the existing home side (particularly if you include shadow inventory). The absolute level of new home inventories is near an all-time record low.
However, a used home is a good substitute for a new home. Thus we are far from out of the woods on housing. Eventually, the combination of a bigger population and a higher rate of household formation will absorb the excess inventory and the housing market will begin to revive.
At that point the homebuilders will be able to start a lot more homes, and that will fuel strong economic growth. That, however, is more a story for the second half of 2011 at the earliest, and more likely a 2012 story.

Leave a Reply