‘Successful investing is anticipating the anticipations of others.‘ (as quoted in Isms (2006) by Gregory Bergman, p.105)
As long as everybody and his grandmother assumes that any ‘dip’ will provide a favorable buying opportunity, a sizable dip really worth mentioning will probably not materialize (for the time being). And with the S&P 500 posting a fresh 52-week high as well as being up better than 1.0% week-to-date and 3.0% month-to-date on a session immediately preceding option expiration week, historically there is not much hope for the bears that this will change right at the start of February’s opex week.
Table I below shows the S&P 500′s probabilities and odds (since 1974 ; in 1973 standardized exchange traded call options were released for trading by the Chicago Board of Options Exchange (CBOE) and the Options Clearing Corporation (OCC)) for a higher | lower close over the course of as well as exactly 1 to 5 sessions later – day 1 to 5 of opex week – in the event the S&P 500
- posted a fresh 52-week high [ OE Week (1) ], and
- was up 1.0+% week-to-date and 3.0+% month-to-date [ OE Week (2) ] on a session immediately preceding opex week, and
- on day 1 to 5 during any opex week [ OE Week (3) ].
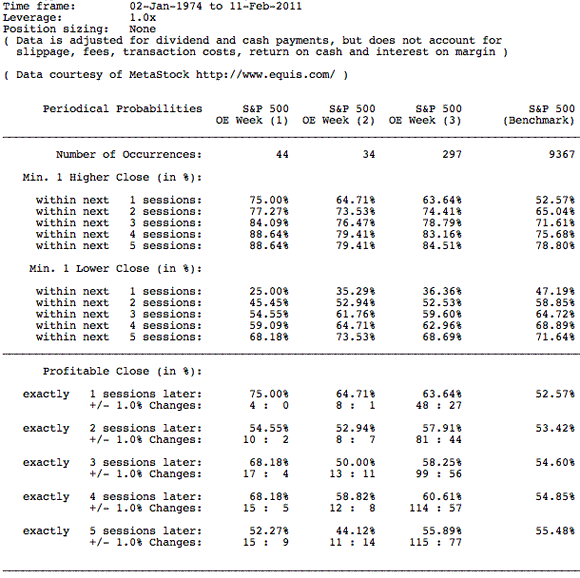
The respective probabilities and odds don’t require much commentary.
Mondays during opex weeks show a noteworthy positive bias in comparison to at-any-time chances for a higher close (63.64% vs. 52.57%), but are even more skewed (75%, or on every 3 out of 4 occurrences, and a maximum loss of -0.92% out of 44 occurrences) in the event the S&P 500 has just posted a fresh 52-week high on close of the last session of the previous week, like it did on Friday, February 11, or in the event the S&P 500 was up 1.0+% week-to-date and 3.0+% month-to-date [ OE Week (2) ] on the same session (8 : 1 chances for a positive : negative 1.0+% move).
Table II below shows all historical occurrences and the S&P 500′s performance during opex week in the event the S&P 500 was up 1.0+% week-to-date and 3.0+% month-to-date [ OE Week (2) ] on a session immediately preceding opex week.
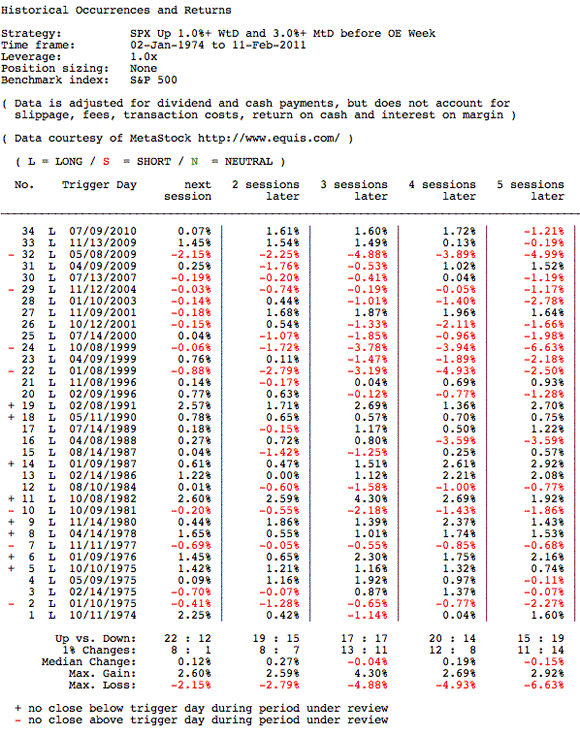
But there might be some hope for the bears again. Although chances for a higher | lower weekly close (‘5 sessions later‘) are more or less even, the S&P 500 closed out option expiration week with a loss on 11 out of the last 13 occurrences, thereof 10 with a loss -1.0+% (the most recent two decades were characterized by reversion to the mean, while before 1990 trend-following was the play du jour).
Table II below now shows all historical occurrences and the S&P 500′s performance during option expiration week in the event the S&P 500 posted a fresh 52-week high [ OE Week (1) ] on a session immediately preceding opex week.
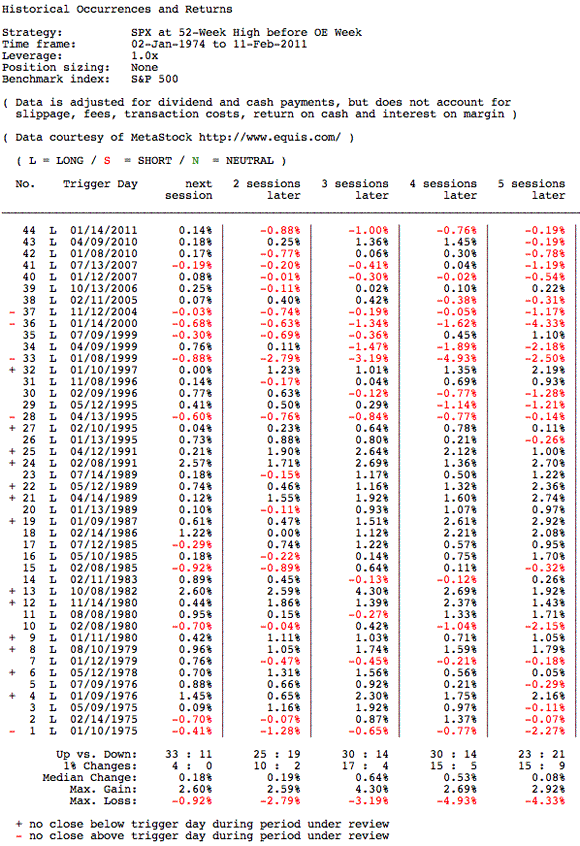
The same recent negative weekly bias as well. While the S&P 500 was regularly trading higher during opex week and on option expiration (until 1995 or on the first 27 occurrences, the S&P 500 never looked back and did not post a single close below the previous week’s close during opex week on 12 occurrences or almost 50% of the time), the index closed out option expiration week with a loss on 10 out of the last 12 occurrences, thereof 3 occurrences where the S&P 500 couldn’t manage a single close above the previous week’s close during opex week.
____________________
Conclusions:
Probabilities and odds are heavily tilt in favor of another positive day right at the start of February’s option expiration week (on Monday, February 24), but at least the recent history calls for some consolidation of recent gains over the remainder of next week and a potentially lower weekly close on February’s option expiration.
Disclosure: No position in the securities mentioned in this post at time of writing.

Leave a Reply