The S&P 500 closed 2010 in a strong fashion, up +0.07% on the last week and up +6.53% on the last month of the year, up +10.20% on the 4th quarter, up +22.02% on the last 6 months (semiannually) and up +12.78% on the year.
A lot of traders, analysts and (blog) authors are looking forward to an at least short-term pullback (regularly between 5.o% and 10.0% anytime soon) pointing to an unsustainable ‘overbought’ state of the market and extreme readings in market sentiment indicators (Investor Intelligence US Advisers Sentiment, the American Association of Individual Investors (AAII) sentiment survey, and the Market Vane Bullish Consensus), among others.
But what happened in the past when the S&P 500 finished a year in a similar strong fashion, and might the first couple of sessions in 2011 possibly provide a clue what to expect over the remainder of the year (if history gives guidance) ?
First of all Table I below shows all occurrences (since 1930), the S&P 500‘s annual performance and the latest occurrence (the latest business day of the year) where the S&P 500 had closed at the highest and lowest level of the respective year in the event the S&P 500 closed out the last week of the previous year with a gain (like in 2010) and posted at least one higher close above the previous end-of-year close between the 2nd and 5th session of the then following year (in this event a close above 1267.64 between Tuesday, January 4 and Friday, January 7, 2011).
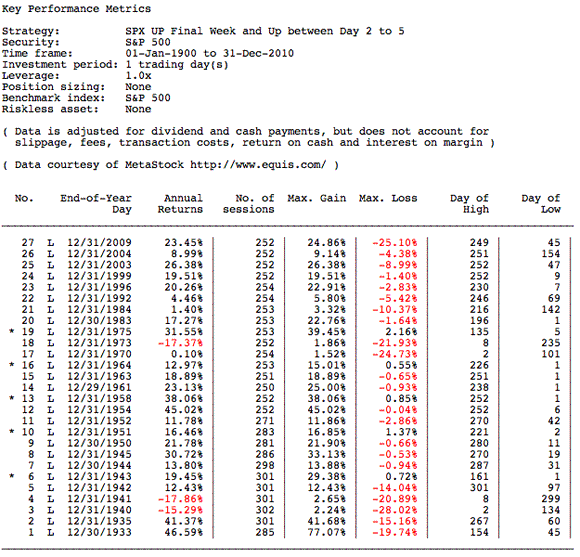
(* no close below trigger day’s close during period under review)
When the S&P 500 was up during the last week of the previous year and closed at an even higher level at least once between the 2nd and the 5th session of the year in the past, the S&P 500
- … finished the year (in this event 2011) with a(nother) (strong) gain on 24 out of 27 occurrences (or 88.89% of the time), thereof 22 out of the last 23 occurrences ;
- … never looked back and did not post a single close below the previous end-of-year close on 5 out of 27 occurrences ;
- … closed out the year almost on the high on 19 out of 27 occurrences (Day of High close to the number of session for the year), but posted its lowest level of the year already in January on 13 occurrences (or almost 50% of the time) ; and
- … posted a median annual gain of 18.89%, almost twice the median at-any-time annual return of 10.26%.
________________
But now I’ll take respect to the fact that the S&P 500 had been up on (almost) all frequencies in 2010: up on the final week and up on the final month of the year, up on the 4th quarter, up on the last second half-year and up on the year as well.
Table II below shows all occurrences (since 1930), the S&P 500‘s annual performance and the latest occurrence (the latest business day of the year) where the S&P 500 had closed at the highest and lowest level of the respective year in the event the S&P 500 had closed up on the final week and on the final month of the year, up on the 4th quarter, up on the last second half-year and up on the year as well (like in 2010) and posted at least one higher close above the previous end-of-year close between the 2nd and 5th session of the then following year (in this event a close above 1267.64 between Tuesday, January 4 and Friday, January 7, 2011).
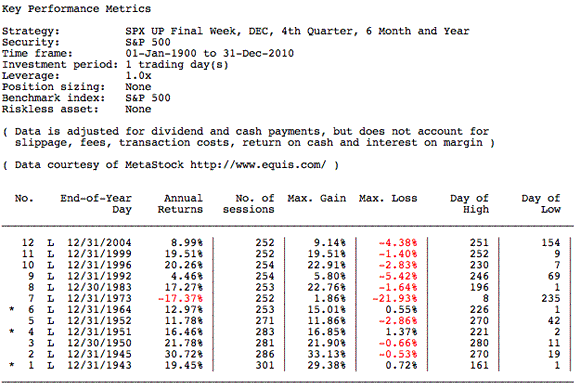
(* no close below trigger day’s close during period under review)
Even when the S&P 500 had closed out a year on a similar strong fashion (like in 2010) in the past, probabilities and odds are still (heavily) tilt in favor of a subsequent strong year. The S&P 500 finished the year (in this event 2011) with a(nother) (strong) gain on 11 out of 12 occurrences, with a median annual gain of +16.87%.
________________
And last but not least I’ll account for the S&P 500‘s magnitude of change during December and the year (2010), and additionally suppose that the S&P 500 will be able to start into the year with a bang, posting a close at least +1.0% above the previous end-of-year close between the 3nd and 5th session of the then following year (in this event a close above 1280.30 between Wednesday, January 5 and Friday, January 7, 2011).
Table III below shows all occurrences (since 1930), the S&P 500‘s annual performance and the latest occurrence (the latest business day of the year) where the S&P 500 had closed at the highest and lowest level of the respective year in the event the S&P 500 had gained at least +2.50% in December and gained at least +10.0% on the year in the past, and posted a close at least +1.0% above the previous end-of-year close between the 3rd and 5th session of the then following year (in this event a close above 1280.30 between Wednesday, January 5 and Friday, January 7, 2011).
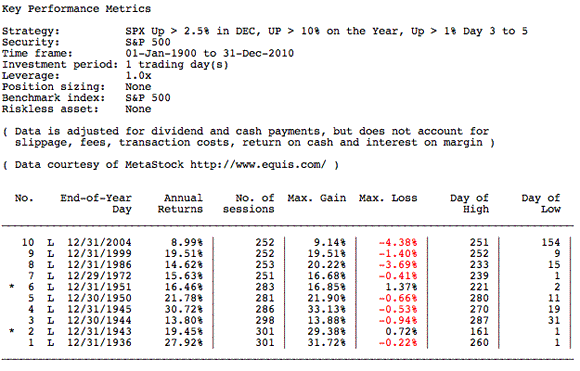
(* no close below trigger day’s close during period under review)
Setup III shows an up to now perfect score of 10 positives (up years) out of 10 historical occurrences. On top of that, downside potential during respective years was regularly limited (more or less non-existent), with a maximum drawdown of -4.38% in 2004. To be triggered in 2011, the S&P 500 will have to post at least one close above 1280.30 (up at least +1.0%) in the Wednesday, January 5 to Friday, January 7, 2011 time frame.
Conclusions:
From a historical and statistical perspective, a strong start into 2011 and a close above 1267.64 (leave alone above 1280.30, see the last setup) in the Tuesday, January 4 to Friday, January 7, 2011 time frame would tilt the odds in favor of a continuation of the recent upmove in the markets and another up year in 2011. I’m lokking forward to the second part of next week …
Disclosure: No position in the securities mentioned in this post at time of writing.
Remarks: Due to their conceptual scope – and if not explicitly stated otherwise – , all models/setups/strategies do not account for slippage, fees and transaction costs, do not account for return on cash and/or interest on margin, do not use position sizing (e.g. Kelly, optimal f) – they’re always ‘all in‘ – , do not use leverage (e.g. leveraged ETFs), do not utilize any kind of abnormal market filter (e.g. during market phases with extremely elevated volatility), do not use intraday buy/sell stops (end-of-day prices only), and models/setups/strategies are not ‘adaptive‘ (do not adjust to the ongoing changes in market conditions like bull and bear markets).

Leave a Reply