If you like to stare at charts and divine meaning (I freely confess to doing so) then you might enjoy having a crack at these two. They’re making the rounds of the blogs today.
I’ll put them up for you and then cite a couple of reactions from others as well as offer mine and then you can have at it.
Ok, here’s what John Carney says:
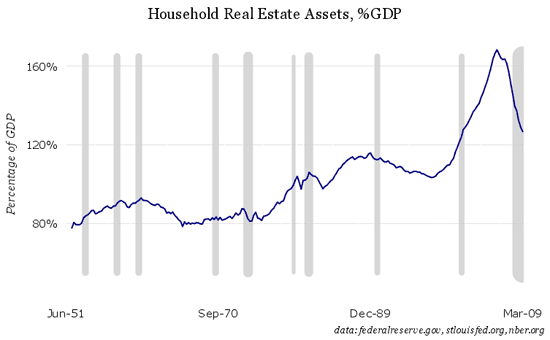
”So does this mean we’ve hit bottom? Not by a long shot. As a percentage of GDP, household real estate is still pricey. As the chart below shows, the value of homes remains at levels never seen before the current bubble. Homes would have to drop ten or twenty percent just to get down to 1980s peak values for houses.”
And Felix Salmon’s somewhat Armageddonish take:
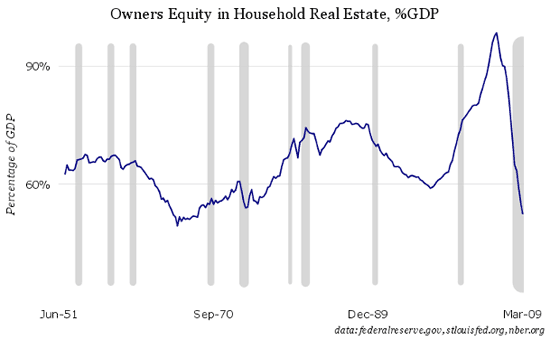
“If this line reverts to the long-term mean, the extra evaporation of housing equity would be utterly devastating. But is there any reason to believe that it won’t?”
Both of these guys were mostly focusing on the first chart which relates housing value to GDP.
Here are some of the things that strike me:
When you look at owners equity as a % of GDP there are only two periods of above trend growth. The 1970’s and 1996 on. There are also a couple of long term downward dips.
I think that the dip in the early years of the chart largely represents a demographic effect as after the war a huge buying spree ensued. The crush of new buyers probably depressed the equity numerator and the big spurt in GDP most likely increased the denominator, thus the trend line is downward.
The only other consistently downward slope is found from around 1989 to 1996. The S&L real estate recession might have something to do with this but I think again demographics and loan terms probably played a bigger role. Though the baby boomers were in this market prior to 1989, there were a lot of them that came into the market in the early 1990’s, very similar to the 1950’s. I think the bigger impact was probably the relaxation of downpayment requirements as the traditional 20% down went out the window.
So why the big upticks in the 1970’s and in the 1990’s into the 2000’s. Well, I think we know why equity soared from 1996 into the 2000’s. As for the 1970’s I suspect that what you see is the effect of stagflation. Value was pushed up by the outsized increase in CPI during that period and the overall economy grew very little. The numerator was forced upwards while the denominator stayed flat. Hence a big jump up over the decade.
Absent outside economic or demographic forces, it looks as if equity has a tendency to trend upwards gradually. Of course, economic and demographic forces are always with us so it’s dangerous to project too much from this graph. We know that the millenials will start buying in force in another five years or so, therefore we might expect to see the trend line much flatter or even downward sloping.
Real estate assets as a percentage of GDP is a bit more normal looking. Still the big jump in the 1970’s which I have to believe is influenced a great deal by stagflation. The 1980’s had a bit of a pop but it leveled off quickly and then our friend the bubble. Salmon is probably right when he suggests a reversion to the trend line could be devestating.
One other quick observation. Except for 2001 it doesn’t appear that housing does particularly well as the country emerges from recession. In all of the other recessionary periods, the metrics measured here have either been flat or declining.
That’s what I see. I may try and dig up another graph this weekend and put it up against these two. Take a look and let me know if you see anything else.
Disclaimer: This page contains affiliate links. If you choose to make a purchase after clicking a link, we may receive a commission at no additional cost to you. Thank you for your support!


Leave a Reply