Initial Claims for Unemployment Insurance fell by 24,000 last week to 435,000. This more than reverses last week’s spike, and once again raises hopes that we might be able to get out of the “trading range” that initial claims have been in for the last year.
Initial claims have been generally trending down since they hit a secondary peak of 504,000 (after revisions) on 8/14. The path has, however, been erratic.
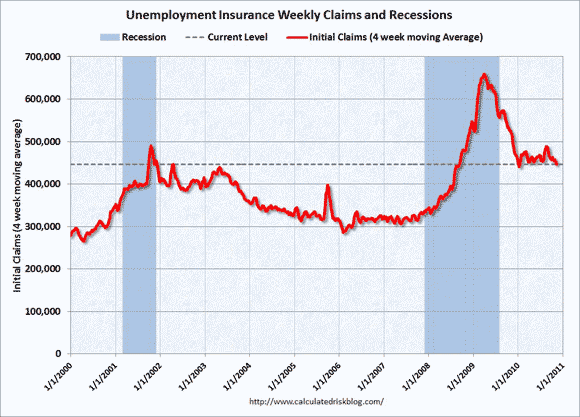
Since claims can be volatile from week to week, it is better to track the four-week moving average to get a better sense of the trend. It fell by 10,000 to 446,500. After declining sharply in the second half of 2009, the four-week moving average has been in a tight trading range.
We seem to be stuck in a pseudo recovery, but if the current downward trend can be sustained, there is real hope. The economy is growing, but not at the sort of rate needed to add a significant number of jobs and to put a dent in the huge army of the unemployed. In hindsight, the run-up to 500,000 seems to be mostly a function of the Census workers being laid off (they are almost all gone now, and the Census was completed quicker, and at less cost than anyone had expected).
As that effect waned, we returned to the previous baseline. Relative to a year ago, the four-week moving average is down by 76,500 or 14.6%. The graph below (from http://www.calculatedriskblog.com) charts the path of the four-week average since the start of the century. Clearly we are knocking on the door of breaking out of the trading range to the downside, but we have been here before and been turned back. That is, after all, what makes a trading range a trading range. So hold off on the Champagne right now.
Continuing Claims
The data on regular continuing claims was positive. Regular continuing claims for unemployment insurance fell by 86,000 to 4.301 million. They are down by 1.382 million or 24.3% from a year ago. Regular claims are paid by the state governments, and run out after just 26 weeks.
However, in October, half of all the unemployed had been out of work for 21.2 weeks (down from 25.5 weeks in June, but up from 40.4 weeks in September), and 41.8% had been out of work for more than 26 weeks. Just for a point of perspective, prior to the Great Recession, the highest the median duration of unemployment had ever reached was 12.3 weeks, near the bottom of the ’82-83 downturn.
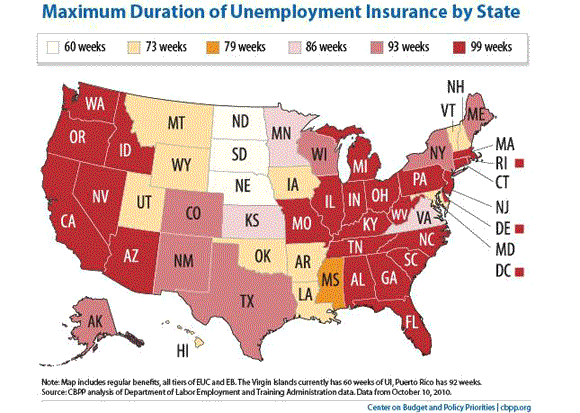
Clearly a measure of unemployment that by definition excludes 41.8% of the unemployed paints a very incomplete picture. After the 26 weeks are up, people move over to extended benefits, which are paid for by the Federal government. These benefits can increase the total amount of time people get benefits to up to 99 weeks (depending on the unemployment rate in your state).
The map below (from http://www.cbpp.org/cms/index.cfm?fa=view&id=3164) shows the maximum length of benefits by state. While regular claims are down, it is in large part due to people aging out of the regular benefits and “graduating” to extended benefits. Although recently even the extended claims have started to trend down. Those fell by 286,000 this week to 4.727 million and are up by 642,000, or 15.7% over the past year.
A much better measure is the total number of people getting benefits, regardless of which level of government pays for them. On that basis, claims fell by 372,000 in the last week, and are down by 740,000 or 7.6% over the last year.
While 99 weeks is a fairly long time — just under two years — it is less than the amount of time since the failure of Lehman Brothers set off the financial meltdown. And we were already in a recession at that point but actually didn’t officially know it.
It was after the meltdown that businesses started to cut jobs at an unprecedented pace. Many of those people still have not found jobs, but they are now aging out of even the extended benefits. By this point, it is a pretty good bet that they have depleted their savings and run up all the debt they can in trying to make ends meet.
Usually, unemployment benefits pay 60% of the income you got while working, but only up to a cap of $400 per week (I say “usually” because it varies some what from state to state). That works out to be just $20,800 per year, or less than the poverty line for a family of four.
Extending Benefits Effective
The vast majority of economists agree that extended unemployment benefits are among the most effective forms of economic stimulus. Although some do worry that by cushioning the blow of unemployment, people might be more reluctant to take a marginal job opportunity, but a below poverty level income is not that much of a cushion.
The people who get the benefits tend to spend the money quickly on basic needs. This in turn keeps customers coming in the door at Wal-Mart (WMT) and Big Lots (BIG). It means that, at the margin, some people are able to continue to pay their mortgages and thus helps keep the foreclosure crisis from getting even worse than it already is. People can buy food at a Kroger’s (KR) rather than having to rely on overstretched food banks.
However, by the time they are well into extended benefits, they might also be spending food stamps as well as the unemployment check. These customers keep the people at all these companies, and of course their competitors, employed. Benefits also keep the people who make and transport those goods employed as well, although in that case much of the stimulus is lost overseas if the goods are imported.
However, it is not clear if the marginal propensity to import is higher for poor (or temporarily poor because they are unemployed) or for the rich. Lots of the stuff on the shelves of Wal-Mart comes from China. On the other hand, the poor are not likely to be buying Swiss watches or German autos.
What is clear is that poor people will spend it quicker, increasing the velocity of money, than will the rich who will tend to save more of it, particularly if they see the increased income from say a continued tax cut for the highest income people as temporary. The rich are much more likely, in other words, to fit Milton Friedman’s “Permanent Income Hypothesis” than are the unemployed, since the rich do not face liquidity constraints.
In addition to being a good source of economic stimulus, and thus benefiting those who are still employed, there is the obvious help to those who get the benefits. While we don’t want unemployment insurance to become a back-door form of welfare and all the dependency issues that raises, unemployment benefits help keep people out of poverty, especially in a deep recession.
In 2009, benefits helped keep 3.4 million people out of poverty, up from 900,000 in 2008, and under 500,000 in 2007. This is shown in the second graph below (from http://www.cbpp.org). Presumably the number will be just as large for 2010 as it was for 2009.
There really is not good way to tell from this report if the decline in the number of people receiving benefits is due to them getting new jobs, or due to even the extended benefits running out. If it is the former, it is very good news. If it is the latter, it just means more people are falling into absolute destitution. That is not good news for either the economy or for social stability.
Both the rise in the unemployment duration numbers and the falling civilian participation rate (it fell from 64.7% in September to 64.5% in October) would suggest that it is the unhappy latter case that is happening.
The big fall in initial claims last week raises the hope that we were finally breaking out of the trading range to the down side. However, it is far too early to declare victory. We seem stuck in economic purgatory of slow growth. That is better then being in the hell of a continuing recession but far from the economic heaven of a real economic expansion that helps bring down the unemployment rate.
We really need to see the four-week average fall below the 400,000 level and stay there if we are going to climb that stairway to heaven. If it shoots above 500,000 then we are on the highway to hell. Right now though, we seem to be just stuck in purgatory.

Leave a Reply