Although you may pay more taxes to the federal government, there is a good chance that the public services you are more likely to actually encounter in your life are provided by state or local governments – schools, swimming pools, police, fire, etc. While a lot of attention has focused on the federal government’s deficit problems, the problem for state and local governments, which generally have less fiscal flexibility (and cannot print money) is at least equally serious.
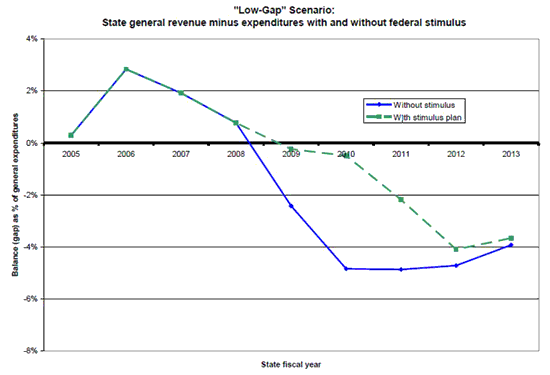
Here is the projected aggregate state/local government budget gap under two scenarios. First the “low gap” (optimistic) picture:
And here’s the high-gap (pessimistic) scenario:
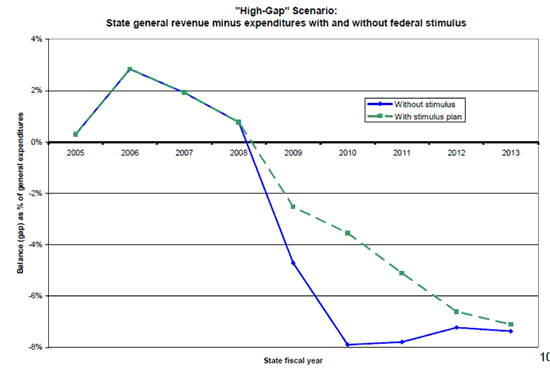
The charts are from a presentation by Don Boyd of the Rockefeller Institute at the Chicago Fed. The space between the solid blue and dashed green lines is the impact of federal aid to states in the most recent stimulus package.
Disclaimer: This page contains affiliate links. If you choose to make a purchase after clicking a link, we may receive a commission at no additional cost to you. Thank you for your support!

Leave a Reply