In August, the total number of job openings in the country rose by 60,000, which, in the context of the 3.201 million total, is pretty close to unchanged. However, over the last year, the total number of job openings is up by 790,000, or 32.8%.
Looking at only private sector openings, they were up by 28,000 on the month, and are up by 751,000 over the last year. Keep in mind that this is August data, and we will be getting data on September tomorrow. This comes from the Job Openings and Labor Turnover Survey, or JOLTS report.
When the September numbers come out tomorrow, they will show the net number of jobs created or lost. The current consensus expectations are for no change in total payrolls, and for private sector payrolls to increase by 74,000, offset by the layoff of the remaining temporary census workers.
Clearly though, a net change of 0 does not mean that nobody found a job in September, or that nobody got fired, got laid off or quit. Just that those two numbers were equal. The JOLTS numbers dig deeper (and come with a month’s delay), and actually look at the number of people getting new jobs, and the number who lost their jobs.
Further, they look at the reason people left their jobs, separating out those who quit from those that left involuntarily. As the table below shows, both hiring and total job losses were above 4.1 million. The 60,000 difference roughly corresponds to the 54,000 total jobs lost in the August payroll survey (there are some minor technical differences in how the two surveys are put together, so it is not unusual for the two to be off by a few thousand, but generally they are very close to each other). The table also details just where the job openings, hires and job losses were by major industry.
For the private sector as a whole, the level of hiring was up by 4.3% from a year ago, and the level of job losses declined by 2.5% from last year. That makes a very big difference in the net number of jobs created or lost in a month, given the size of both the hiring and firing that goes on in any given month. In August 2009, a total of 187,000 jobs were lost in the private sector, and in August of 2010 70,000 private sector jobs were created (using the JOLTS numbers for both months).
Relative to a year ago, Construction job openings are almost unchanged (and down 32.7% from July). Manufacturing job openings are up by 43.3% from a year ago, but down 19.3% from July. Historically, construction jobs tend to rebound early in a recovery, but that just is not happing this time around given the massive overhang of existing homes for sale due to the popping of the housing bubble and the foreclosure crisis.
The biggest year-over-year growth in job openings has come from the professional and business services industry. That is the industry that includes the temporary employment agencies like Kelly Services (KELYA) and Manpower (MAN). Increases in temporary employment are often a leading indicator of increase in permanent full-time employment as employers are generally reluctant to hire full-time and permanent employees as soon as business picks up, since they are not sure if it will last or not. So instead they call up the temp agencies.
The government hiring and firing numbers are still significantly distorted by the temporary Census layoffs. For all levels of government, there were 4,000 net layoffs in August of 2009 and 129,000 in August 2010.

The overall picture, though, is still one where the rate of labor turnover in the economy is unusually slow. Unfortunately, the JOLTS survey is a relatively new data series, only going back to 2000. It thus makes it impossible to say to what extent the slowdown in labor turnover is a normal occurrence during economic slowdowns.
Still, it seems pretty clear that the key problem in the economy in so far as jobs are concerned is not an excessive number of people getting laid off, it is that there just are not a lot of people getting fired. That helps to explain why the duration of unemployment numbers have been so high in this downturn relative to any previous post WWII recession.
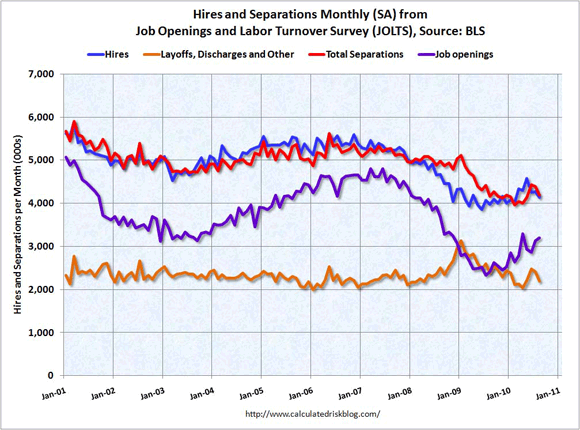
The graph below (from http://www.calculatedriskblog.com) shows the history of job openings, hires, total job losses and involuntary job losses. Note that the blue line of hires tends to be close to the red line of total separations. The difference between the two lines roughly corresponds to the monthly total jobs gained (blue line above the red line) or lost (red line above blue) in the BLS employment report.
What is striking is how low both are relative to the overall history. Yes, the economy has been weak over the last few years, but the simple fact is that more than a million fewer people lost their jobs on average per month over the last year than lost them on average in 2006 or 2007. The big problem is the number of jobs being created fell even more. It is the lack of hires — not the number of fires — that’s the problem in this economy. It also suggests that the Stimulus program was far more successful at saving than creating jobs.
The uptrend in the number of job openings is highly encouraging, but the total number of job openings is only back to where it was at the bottom of the jobless recovery that followed the 2001 recession. The increase in job openings, but the relative lack of upward movement in the number of people actually getting hired does raise disturbing questions about how much of the unemployment is structural in nature rather than cyclical.
Structural unemployment is when there are jobs available, but the unemployed are not qualified to fill them. For example, there might be a lot of job openings for nurses, and lots of unemployed construction workers, but that does not mean you want to hire a roofer to help out in the operating room.
The other key source of structural unemployment is geographical. A job opening in Bismarck, ND is not going to help out someone in Boston who is unemployed. In the past, one of the great strengths of the U.S. was the degree of geographical mobility we had. People would move from Boston to Bismarck for a new job. However, if you owe $300,000 on your house in Boston and can only get $250,000 if you want to sell it and move to take another job, that $50,000 a year job in Bismarck is just not that appealing.
I seriously doubt that the skills mismatches have grown significantly over the past few years, though it seems pretty clear with almost one in four homes with mortgages now underwater, the degree of geographic structural unemployment has increased.
There was some more good news in the report. People who leave their jobs either leave voluntarily (“take this job and shove it”) or involuntarily (“you’re fired/laid off”). If people are worried about the overall economy, the last thing they generally want to do is quit an existing job. Note for example that during 2008 the total number of job losses (red line) was almost unchanged while the number of people laid off increased by over a million or 50%. People simply quit quitting as the economy turned south. Given the distortions caused by the Census, it is better to focus on the private sector numbers.
In August 2009, a total of 1.669 million people quit their private sector jobs, or 43% of all people who left a job. In August 2010, 1.881 million people told their boss where they could stick their job, or 50% of the total. That is an increase of 212,000 people per month who felt confident enough to walk away from an existing paycheck. In contrast, in August 2009, 2.006 million people were fired or laid off from private sector jobs or 52% of the total (5% retired which is different from either quitting or being laid off). In August 2010, the number of people being laid off had fallen to 1.594 million, a drop of 412,000 or 20.5%. As a percentage of all private sector job losses, layoffs fell to 42%.
The decline in both the number of people being laid off, and as a percentage of those losing their jobs, is very good news. It coincides with a big increase in the number of available job openings, and shows that people are much more confident about their ability to find a new job (what is not detailed is the number of people who already have a new job lined up before they quit their old job).
We are making progress on the employment front if you look at the underlying trends. However, the damage to the economy inflicted by the popping of the housing bubble and the associated near collapse of the entire world financial situation has dug an enormous hole. We are not making progress fast enough to get out of that hole quickly, but at least it is very clear that we have stopped digging it deeper. We are headed in the right direction, but need desperately to step on the accelerator.

Leave a Reply