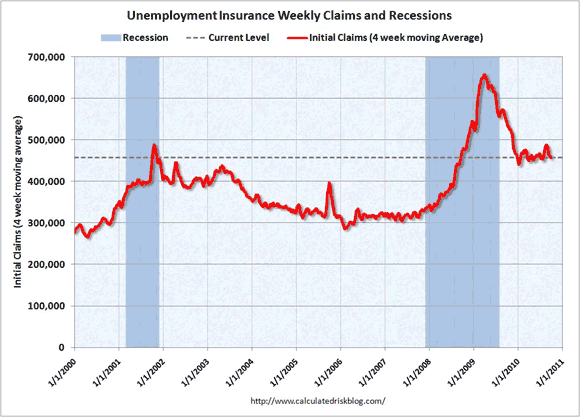
Initial Claims for Unemployment Insurance fell by 16,000 last week to 443,000. That more than reverses last week’s increase.
Since claims can be volatile from week to week, it is better to track the four-week moving average to get a better sense of the trend. It declined by 6,250 to 458,000. After declining sharply in the second half of 2009, the four-week moving average has been stuck in a tight trading range.
Just over a month ago, the weekly number hit 500,000 and threatened to break out to the upside from the range. But the decline over the last month brought us down to 450,000 (before being revised up to 453,000), which brought hopes that we might be breaking out to the downside. This week’s number raises a little bit of hope we might break out to the downside, but let’s not count our chickens before they are hatched.
Pseudo-Recovery?
We seem to be stuck in a pseudo recovery. The economy is growing, but not at the sort of rate needed to add a significant number of jobs and to put a dent in the huge army of the unemployed. In hindsight, the run up to 500,000 seems to be mostly a function of the census workers being laid off (they are almost all gone now, and the census was completed quicker — and at less cost — than anyone had expected).
As that effect waned, we returned to the previous baseline. Relative to a year ago, the four-week moving average is down by 88,750 or 16.2%. The graph below (from http://www.calculatedriskblog.com) charts the path of the four-week average since the start of the century.
Continuing Claims
The data on continuing claims was also positive. Regular continuing claims for unemployment insurance fell by 83,000 to 4.489 million. They are down by 1.553 million or 25.8% from a year ago.
Regular claims are paid by the state governments, and run out after just 26 weeks. However, in August, half of all the unemployed had been out of work for 19.9 weeks, and 42.0% had been out of work for more than 26 weeks. Clearly a measure of unemployment that by definition excludes 42.0% of the unemployed paints a very incomplete picture.
After the 26 weeks are up, people move over to extended benefits, which are paid for by the federal government. These benefits can increase the total amount of time people get benefits to up to 99 weeks (depending on the unemployment rate in your state). While regular claims are down, it is mostly from people aging out of the regular benefits and “graduating” to extended benefits. Those fell by 293,000 this week to 4.879 million and are up by 891,000, or 22.3% over the past year.
A much better measure is the total number of people getting benefits, regardless of which level of government pays for them. On that basis, then, claims fell by 376,000 in the last week, and are down by 662,000 or 6.6% over the last year.
While 99 weeks is a fairly long time — just under two years — it is not forever. It is less than the amount of time since the failure of Lehman Brothers set off the financial meltdown. While we were already in a recession at that point (but actually didn’t officially know it, just as we just recently learned officially that the recession ended in June 2009) it was after the meltdown that businesses started to cut jobs at an unprecedented pace.
Many of those people still have not found jobs, but they are now aging out of even the extended benefits. By this point, it is a pretty good bet that they have depleted their savings and run up all the debt they can in trying to make ends meet. Usually, unemployment benefits pay 60% of the income you got while working, but only up to a cap of $400 per week (I say “usually” because it varies some what from state to state). That works out to be just $20,800 per year, or less than the poverty line for a family of four.
Extending Unemployment Benefits
The vast majority of economists agree that extended unemployment benefits are among the most effective forms of economic stimulus. The people who get them tend to spend the money quickly on basic needs.
This, in turn, keeps customers coming in the door at Wal-Mart (WMT) and Big Lots (BIG). It means that, at the margin, some people are able to continue to pay their mortgages and thus helps keep the foreclosure crisis from getting even worse than it already is. People can buy food at a Kroger’s (KR) rather than having to rely on overstretched food banks.
However, by the time they are well into extended benefits, they might also be spending food stamps as well as the unemployment check at Kroger’s. These customers keep the people at Wal-Mart, Big Lots and Kroger’s, and of course their competitors, employed. It also keeps the people who make and transport those goods employed as well, although in that case much of the stimulus is lost overseas if the goods are imported.
However it is not clear if the marginal propensity to import is higher for the poor (or the temporarily poor because they are unemployed) or for the rich. Lots of the stuff on the shelves of Wal-Mart comes from China. On the other hand, the poor are not likely to be buying Swiss watches or German autos.
What is clear is that they will spend it quicker, increasing the velocity of money, than will the rich who will tend to save more of it, particularly if they see the increased income from say a continued tax cut for the highest income people as temporary. The rich are much more likely, in other words, to fit Milton Friedman’s “Permanent Income Hypothesis” than are the unemployed, since the rich do not face liquidity constraints.
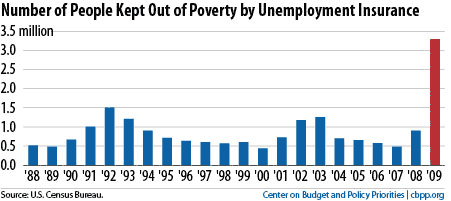
In addition to being a good source of economic stimulus, and thus benefiting those that are still employed, there is the obvious benefit to those that get the benefits. While we don’t want unemployment insurance to become a back-door form of welfare and all the dependency issues that raises, unemployment benefits help keep people out of poverty, especially in a deep recession.
In 2009, it helped keep 3.4 million people out of poverty, up from 900,000 in 2008 and under 500,000 in 2007. This is shown in the second graph below (from http://www.cbpp.org). Presumably the number will be just as large for 2010 as it was for 2009.
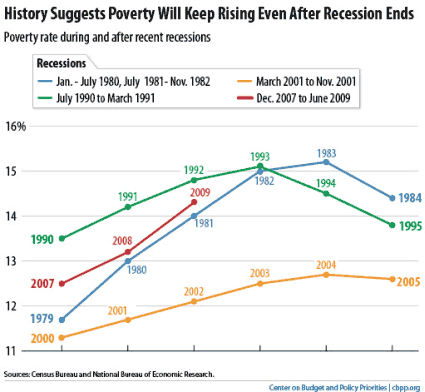
However, to the extent that people age out of even extended benefits without finding new jobs, the poverty rate will continue to rise. It normally does during and just after recessions, particularly if the recovery is slow and anemic as this one — and the last two — has been so far. Even after the 1981-82 recession ended — and that one featured a much stronger recovery — the poverty rate continued to rise for a year afterwards.
Following the end of the previous recession, which ended in November 2001, we did not see a decline in the poverty rate until 2005, and then it was so small as to be virtually undetectable before it started to rise again. The path of the poverty rate during and after recessions is shown in the third graph (also from http://www.cbpp.org). A high poverty rate is not good for business. It is also not good for social stability.

Leave a Reply