Housing Starts surged in August, but the good news is probably better toasted with Miller than with Moet. Total housing starts rose 10.5% to an annualized rate of 598,000, well ahead of consensus expectations of just 550,000. However, that was from July starts that were revised down to a rate of just 541,000 rather than the original 546,000. Also, almost all of the increase can be traced to the extremely volatile apartment and condo part of the housing market.
Single family starts, which is what most people think of as homebuilding, rose just 4.3% from July to an annual rate of 438,000. Relative to a year ago, total starts are up 2.2%, and single family starts are actually down 9.1%. It is not as if the housing market was exactly booming a year ago, either.
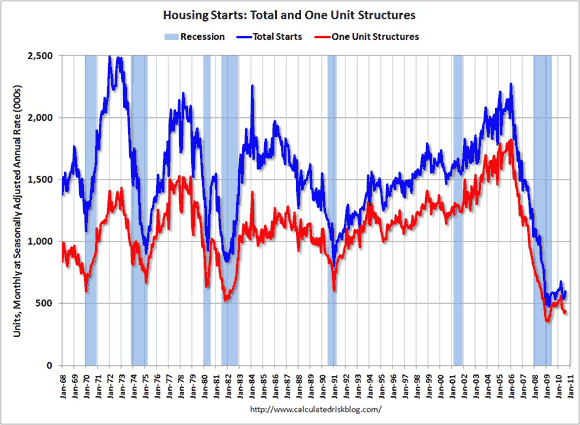
Relative to the peak of the housing bubble (6/06, 2.273 million), total starts are down 73.7%. For single family starts, we are down 76.0% from the peak (1.823 million 6/06). Even with the rise, we are far below the home building pace at the bottom of previous downturns. Prior to the Great Recession, the lowest we ever got was 837,000 in total (11/81) and 523,000 for single family (10/81).
The graph below (from http://www.calculatedriskblog.com) shows the history of housing starts, both total and single family, since the late 1960’s. It helps put this month’s increase into perspective.
Starts of apartment and condos (more than four units in the building) have been surging in recent months. In August, they rose 42.7% to an annual rate of 147,000. That comes on top of a 22.6% month to month surge in July. Year over year, starts are up 53.1%. Apartment starts tend to be extremely volatile, so while this rise is good news in terms of jobs for construction workers and overall economic activity, it is hard to be sure if it really is a robust recovery.
The vacancy rate for apartments is also very high, so the added supply may result in downward pressure on rents. That, however, is probably less of a problem than additional supply of single-family houses putting direct downward pressure on housing prices (lower rents though can indirectly put pressure on housing prices).
Regionally, starts were extremely uneven. In the Northeast, starts plunged 24.3% for the month and are 21.1% below last year. Fortunately, though, the Northeast is by far the smallest, and therefore least important, of the four census regions when it comes to housing. It accounted for just 9.4% of all housing starts in August.
In the South, the largest of the four regions (48.3% of all starts in August), starts were up 7.0% for the month and up 2.8% from a year ago. The Midwest did much better with a 21.7% increase for the month, but up just 5.7% year over year. The West was the best with a 34.3% increase on the month and up 11.0% year over year.
Building Permits
So will this revival of the homebuilding market, such as it is, continue? The best leading indicator of home starts is building permits. They rose 1.8% on the month to an annual rate of 569,000. The July rate was revised down to 559,000 from the original 565,000. Year over year, total permits were down 6.7%.
As with starts, the strength was in the multifamily part of the housing market. Single-family permits were down 1.2% to an annual rate of 401,000, and were 16.8% lower than a year ago. Apartment starts were up 11.9% on the month and up 38.9% from a year ago. Thus it does look like we could have some more strength in the next few months, but it will all be on the multifamily side.
The regional pattern for permits is very different from that for starts. Permits in the Northeast were unchanged on the month and down 4.3% year over year, in the South they were down 2.5% for the month and off 11.8% year over year. The Midwest saw a 5.3% decline for the month and is off 15.2% from last year. The West on the other hand looks like it has a real rebound on its hands, with starts up 19.0% on the month and up 12.2% year over year.
Overall: Big Positive
Overall, I would have to rate this report as being a big positive for the economy, at least in the short run. Residential investment, the largest part of which is new home construction, is normally what pulls economies out of recessions. Take a good hard look at the chart above and the relationship between the bottom in housing starts and the blue recession bars if you have your doubts about that.
Each house that is started generates a huge amount of economic activity. For starters, it puts people to work actually building the house. The construction industry has been particularly hard hit in this downturn, accounting for about one in every four jobs lost. Those are relatively high paying jobs for people who do not have a lot of formal education.
Most of the building materials used in housing are produced domestically (in part because they tend to be heavy, and thus shipping costs are a big issue) so the increased demand for bricks, roofing materials, lumber, sheetrock and plumbing fixtures leads to increased employment at Berkshire Hathaway (BRK.B), Weyerhaeuser (WY), USG (USG) and Fortune Brands (FO), not just increased employment at Lennar (LEN). With jobs and hence money in their wallets, those construction workers then go out and spend, further increasing aggregate demand and employment.
The uptick in housing starts is very good news in that regard, particularly if it can be sustained. Per unit, single family homes tend to consume more materials and labor than do condos, so it would be better if the surge were coming from the single-family side. On the other hand, the glut of excess inventory of used houses (including the shadow inventory of foreclosed, or soon to be foreclosed houses) is so great that one has to be aware of the dark cloud that comes with this silver lining.
Eventually, demographics are going to dictate a rise in housing starts. The population is rising, and they are going to need somewhere to live. During the recession, though, the rate of household formation has plummeted. In other words, even though there are more people, there are not as many households. Kids don’t move out of mom and dad’s house if they don’t have a job that will pay the rent. When people lose their homes to foreclosure, often they move in with relatives rather than renting or literally being on the street.
If the pick up in construction activity results in more people getting jobs, then that dynamic can start to be reversed. It is not going to take very heroic levels of housing starts to generate very large percentage increases. A doubling in total housing starts would still result in a level of starts that until now would have been considered deeply depressed and recessionary, even with the much smaller populations of the time.
The Importance of Housing Activity
The lack of housing activity is the single most important reason that this recovery has been so sluggish relative to most other economic recoveries. On the other hand, the previous two recoveries were also very sluggish. The 2001 downturn did not really see a sharp decline in housing starts and starts just continued on their merry way higher as the bubble inflated. The recovery after the 1991 downturn did have a sharp housing rebound, so the sluggish recovery after that one is harder to explain.
Given that the Great Recession was caused by the mother of all housing meltdowns, and the big overhang that housing still represents for the country, the fact that we got out of the recession at all starting in June 2009 is sort of remarkable. It is very hard to pull a train forward when its biggest locomotive is derailed.
Now, perhaps — just perhaps — that locomotive is back on the tracks. If so, that is very good news for the economy. Just how big a problem the additional supply will be for the overall housing market will be, in part, answered on Friday when the new home sales figures come out. If new houses are being bought, then this is good news, if they are just sitting in inventory, well then, “Houston, we have a problem.”

Leave a Reply