Total Industrial Production rose by 0.2% in August, which was a tick less than the 0.3% rise that was expected. It was also slower than the 0.6% rise in July. The July number was revised down from a 1.0% increase, but June was revised to an increase of 0.1% from a decline of 0.1%.
Relative to a year ago, total Industrial Production is up 6.2%. These numbers are slightly disappointing, but far from a disaster, as much of the weakness can be traced to some seasonal adjustment problems.
Total Industrial Production includes not only the output of the nation’s factories, but of its mines and utility power plants as well. The production and consumption of electricity generally has as much to do with the weather as it does with overall economic activity.
Manufacturing Output
Thus it is important to look at just how the manufacturing sector is doing alone. It, too, increased at 0.2% down from a 0.7% increase in July. The July number was revised down from an increase of 1.1%, and June was revised to a decline of 0.4% from a decline of 0.5%. Year over year, factory output is up 6.3%.
Much of the big swing between July and August can be traced to some seasonal adjustment factors related to the Auto industry. Normally Detroit shuts down for a few weeks during July for model changeovers. That did not happen this year. As a result, the seasonal adjustment showed a big increase in the July numbers, and then since the seasonal adjustment expects a jump in August as the Auto Factories come back on line, we see a decline in the August seasonally adjusted numbers. Excluding Autos, manufacturing output was up 0.5% in August after being up just 0.2% in July.
Utility Output
Utility output fell by 1.5% in August following a 0.3% decline in July, but that came after a 4.0% jump in June. June was the hottest June on record nationwide (and worldwide for that matter), but the weather was more seasonally normal in late July and August. If the weather is hotter than normal in the summer, electricity demand shoots up as people run their air conditioners more. Year over year, utility output is up 6.0%.
Mining Output
The third sector tracked by the report is Mining (including oil and natural gas). The output of the nation’s mines rose by 1.2% after a 0.9% rise in July, but a 0.6% decline in June. The June decline was partially due to the BP (BP) oil spill disaster in the Gulf of Mexico, and some of the increase in July and August is a rebound from that. However, it probably also reflects the increasing output of shale natural gas as well.
Weakness in Consumer Goods
By stage of production, output of finished goods fell by 0.1% after increasing 0.9% in July and having been unchanged in June. Year over year, finished goods production is up 6.1%. All of the weakness came from the output of consumer goods, which fell 0.4% after being up 0.8% in July and down 0.2% in June.
Consumers are trying hard to rebuild their balance sheets. That means spending less on current consumption while paying down debt and building up savings. That is a tough thing to do when you are unemployed, but the 90.4% of people who are working are doing their best to get their personal fiscal houses in order. In addition, a large part of consumer finished goods are imports, not made here in the U.S. Year over year, output of consumer goods is up 4.4%.
Business Equipment Up Again
Business equipment output, on the other hand, has been surging, rising 0.7% in August on top of increases of 1.0% in July and 0.7% in June, and up 9.9% year over year. Business investment in Equipment and Software has been one of the strongest parts of the economy, contributing 1.36 points of the 2.39% total growth in the economy in the second quarter, even though it makes up less than 7% of GDP.
Business investment looks like it will be another strong contributor in the third quarter as well. Output of materials rose 0.4% in August on top of a 0.6% increase in July, and was unchanged in June. Materials output is up 7.1% year over year.
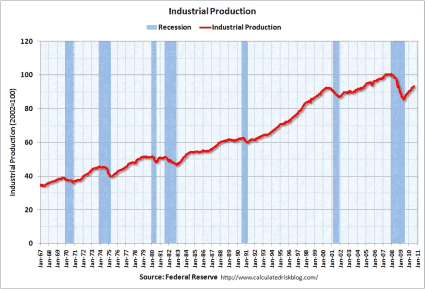
The first graph (from http://www.calculatedriskblog.com) below shows the long-term path of total industrial production. While we are in much better shape than we were a year ago, total production is still well below pre-recession levels. That is not particularly unusual a year or so after the end of a recession; it usually takes at lest two years after production bottoms to reach a new high. In the Great Recession, it fell much more than it had in any previous downturn.
Capacity Utilization
The other side of the report is Capacity Utilization. This is one of the most under-appreciated economic indicators out there, and one that deserves a lot more attention and ink than it usually gets.
Total capacity utilization suffers from the same weather related drawback as does industrial Production. However, it ticked up to 74.7% from 74.6% in July and 74.1% in June. July, though, was revised down from 74.8%, so from the perspective of where we thought we were, it is actually a tick down in August.
The revival of capacity utilization has been going on for more than a year now. A year ago, just 70.0% of our overall capacity was being used, and that was up from a record low of 68.2% in June 2009.
The basic rule of thumb on total capacity utilization is that if it gets up above 85%, the economy is booming and in severe danger of overheating. This effectively raises a red flag at the Fed and tells them that they need to raise short term interest rates to cool the economy. It is also a signal to Congress that it is time to either cut spending or raise taxes, also to cool down the economy (Congress seldom listens to what capacity utilization is saying, but the Fed does.
Capacity utilization of around 80 signals a nice, healthy economy, sort of the “Goldilocks” level — not too hot, not too cold. The long-term average level is 80.6%. A level of 75% is usually associated with a recession. The Great Recession was the only one on record where it fell below 70%. Thus a 6.5% improvement in overall capacity utilization from the lows is highly significant and very good news.
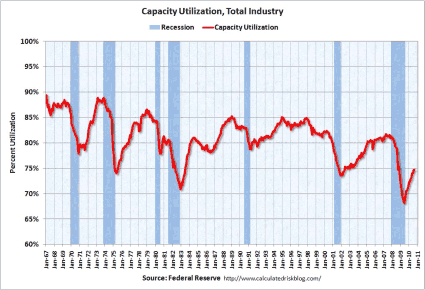
On the other hand, we still have a very long way to go for the economy to be considered healthy. The second graph (also from http://www.calculatedriskblog.com) shows the path of total capacity utilization since 1967.
Factory Utilization
Factory utilization rose to 72.2% from 72.1% in July and 71.6% in June. July was revised down one tick from 72.2%, so in that sense we are flat month to month, but June was revised up two ticks from 71.4%. That is up from 67.6% a year ago, and the cycle (and record) low of 65.4%. That is still well below the long-term average level of 79.2%, so as with total capacity, we still have a long way to go on the factory utilization level.
The increase in utilization over the last year — both total and factory — has been aided by a decline in capacity, with the total falling 0.5% and factory capacity dropping 0.6%. If some factories are closed and dismantled, it is easier to run the remaining ones closer to full time. However, the increase for the month was probably bigger than reported (and the increase in July smaller than reported) due to the seasonal adjustment effects of the non-summer shutdown at General Motors and Ford (F).
Mines were working at 86.3% of capacity in August, up from 85.3% in July and 84.6% in June. A year ago they were only operating at 81.7% and the cycle low was 79.6%. We are almost back to the long-term average of 87.4% of capacity. Since there is a lot of operating leverage in most mining companies, this probably means very good things for the profitability of mining firms with big U.S. operations like Freeport McMoRan (FCX) and Peabody Energy (BTU). Mine capacity was unchanged year over year.
Utility Utilization
Utility utilization dropped to 81.0% from 82.4% in July and 82.7% in June, and is up from 77.9% a year ago, and a cycle low of 77.6%. We are, however, far below the long-term average utilization of 86.7%. The month-to-month decline was probably more a function of the weather than a change in economic activity, while the year-over-year increase is probably more reflective of a better economy. Increasing utility utilization faces a headwind because, unlike factories, our power plant capacity has actually been increasing significantly, up 1.9% year over year.
By Stages of Processing (Crude, Semi-Finished, Finished)
By stage of processing, utilization of facilities producing crude goods (including the output of mines) rose to 85.4% from 84.5% in July and 84.0% in June. A year ago, crude good facilities were operating at just 80.6% of capacity, and the cycle low was 78.3%. We are within spitting distance of the long-term average of 86.5%. On the other hand, capacity has declined by 0.7% over the last year.
The same cannot be said for utilization for primary, or semi-finished, goods. It ticked down to 72.4% from 72.5% in July but up from 72.2% in June. While that is much better than the 67.1% level of a year ago and the cycle low of 65.7%, it is a very long way from the long-term average of 81.6%.
Utilization of facilities producing finished goods rose to 73.5% from 73.4% in July and 72.8% in June and is up from 68.8% a year ago, and a cycle low of 67.5%. It also remains well below its long-term average of 77.5%. The auto non-shutdown over the summer probably played a role in the big seasonally adjusted increase in July, and the relatively small increase in August. Interestingly, our capacity to produce finished goods has actually increased by 0.4% over the last year.
A Slight Disappointment
Overall, this report was slightly disappointing, but most of the disappointment can be traced to more normal seasonal weather and to some seasonal adjustment factors. Once those are accounted for, it seems clear that we are headed in the right direction, but still have a long way to go.
The low levels of capacity utilization are one of the key reasons that inflation has remained low, and is not much of a threat in the intermediate future. This gives the Fed free reign to not only keep short-term interest rates at extraordinarily low levels for an extended period of time (probably until at leas the end of 2011), but to take even more aggressive steps to ease monetary conditions, such as buying very large quantities of longer-term T-notes. While under ordinary circumstances, doing so would raise a big threat of inflation accelerating, we do not live in ordinary times.
Right now the bigger threat is deflation, not runaway inflation. The bond market clearly seems to agree — there is no other rational explanation for 10-year T-note yields to be at just 2.67%. Provided that inflation does not restart from an aggressive increase in the money supply, the Fed’s purchase of very large amounts ($500 billion to $1 trillion) worth of longer-term T-notes will probably keep longer-term interest rates on the low side for awhile. However at the first sign of inflation they would probably shoot higher.
While the economy is recovering, it is still running at levels far below its potential. The capacity utilization numbers can be thought of as sort of like the employment rate for physical capital, much like the employment-to-population rate is the employment rate for human capital. Both are running well below where we want them to be.
While additional monetary stimulus would be useful at the margin, the cost of capital is not the major issue right now, it is lack of aggregate demand. As such, additional fiscal stimulus would be much more effective in getting the economy going again. With long-term rates on T-bonds at historic lows, financing the higher deficits is not a problem. Getting the economy back into high gear would also start to raise tax revenues, and so the net cost of additional stimulus would be far less than the advertised amount. Of course, the two are not mutually exclusive and the economy would benefit from both being used.
FORD MOTOR CO (F): Free Stock Analysis Report
PEABODY ENERGY (BTU): Free Stock Analysis Report

Leave a Reply