In June, the nation’s Trade Deficit jumped to $49.90 billion from $41.98 billion in May, and from just $27.14 billion a year ago. That is an 18.9% rise for the month and a 83.9% increase from a year ago. It is far worse than the expectations which were for the trade deficit to be more or less unchanged from May.
It also strongly suggests that when the next look at second quarter GDP comes out that it will be revised downwards. The trade deficit is a direct subtraction from GDP in the form of net exports, so any increase in it directly hits GDP growth.
In just a hint of a silver lining, the May trade deficit was revised down from an original read of $42.27 billion. Our exports were $150.45 billion in June, down from 152.44 billion in May (down 1.3%) but up from $127.87 billion (up 17.7%) from a year ago. Since growth of 15% will result in a doubling in less than five years, that means the economy is on its way towards achieving President Obama’s goal of doubling U.S. exports over five years.
But so what? It is not really exports that count, but net exports. An increase in overall world trade is generally a good thing, but if our imports more than double while our exports just double, the U.S. will be in far worse condition five years from now than it is today. That is what seems to be happening. Our imports jumped to $$200.35 billion from $194.42 billion in May (up 3.1%) and from $155.01 billion a year ago (up 29.2%). At that rate, our imports would almost quintuple over five years.
However, it should be noted that both imports and exports were severely depressed a year ago. A year ago was near the absolute low point of the Great Recession, and the June 2009 trade deficit was 55.7% below the June 2008 level, due to a 31.1% year over year decline in imports and a 21.8% decline in exports.
The trade deficit in June was still 18.6% below the level of two years ago. Thus it would be a mistake to simply extrapolate the year-over-year growth in the deficit, or for imports or exports for five years into the future. Still, even if the trade deficit were to level out at the $60+ billion per month levels that prevailed two years ago, that would be an extremely worrisome development for the long-term health of the economy.
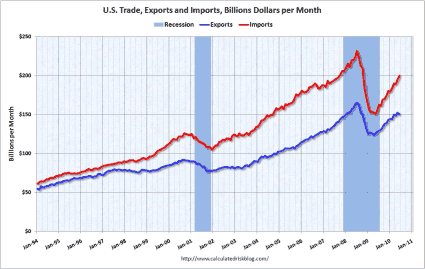
The graph below (from http://www.calculatedriskblog.com/) shows the long-term path of our imports and exports (the trade deficit being the distance between them). The Great Recession caused an absolute collapse in world trade, and with it a sharp drop in the U.S trade deficit, but now world trade is recovering, and with it so is the U.S. trade deficit.
Without the drop in the trade deficit, the decline in GDP would have been far worse during the worst part of the Great Recession. For example, in the first quarter of 2009, GDP would have dropped over 9% rather than “just 6.4%” without the drop in the trade deficit.
U.S. Trade Exports Imports
The deficit all comes from the Goods side of the equation, not Services, where we tend to run a small surplus. In June, the goods trade deficit was $62.03 billion up from $54.34 billion in June (up 14.2%) and up from $38.24 billion a year ago (up 62.2%). The Service surplus fell to $12.14 from $12.25 billion in May (down 1.7%) but up from $11.10 billion a year ago (up 9.4%). The jump in the Goods deficit came both from rising imports and falling exports. In June, goods exports fell to $104.98 billion from $107.31 billion in May (down 2.2%) but are up from $86.58 billion a year ago (up 21.3%). Imports rose to $167.01 billion from $161.64 billion in May (up 3.3%) and from $124.82 billion a year ago (up 33.8%).
Put another way, in June, for every dollar worth of stuff we sold to the rest of the world, we bought $1.59 worth of their stuff. A year ago, we bought $1.44 worth of their stuff for every dollar worth of stuff we sold to them.
The Service surplus declined slightly to $12.14 billion from $12.25 billion in May (down 1.7%) but is up from $11.1 billion a year ago (up 9.4%). However, even though services are a much bigger part of the U.S. economy than are goods, they are much less likely to be internationally traded. By their very nature, many services have to be performed on site. How, for example, could one export a haircut? Thus even though the U.S. does far better in selling our services to the rest of the world than we do (at least on a relative basis) selling our goods to the world, goods still make up almost 70% of our exports (and 83.3% of our imports).
A big part of our goods deficit comes from our oil addiction, but that has not been the main factor in the increase in the trade deficit. Our petroleum deficit fell to $21.20 billion in June from $21.49 billion in May (down 1.3%) and is up from $17.04 billion a year ago (up 24.4%). It was our non-oil deficit that jumped in June to $40.02 billion from $32.23 billion in May (up 24.2%) and from $21.10 billion a year ago (up 89.7%).
In other words, oil has dropped to 42.5% of our total trade deficit from 62.8% a year ago. The second graph (also from http://www.calculatedriskblog.com/) breaks down the trade deficit (blue line) into its petroleum (black) and non petroleum (red) parts over time.
U.S. Trade Deficit
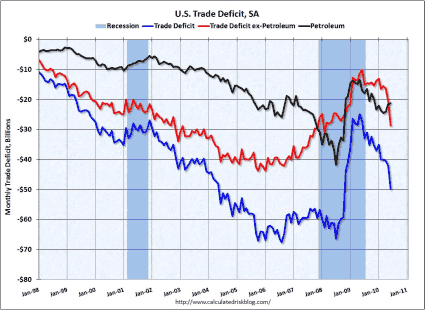
The non-oil part of the trade deficit actually started to level out in mid-2004, and started to improve sharply in early 2007. That progress, though, was masked by a sharp deterioration in the oil side of the deficit, as the price of oil spiked from early 2007 through the summer of 2008. The collapse in oil prices during the freeze up of the financial markets proved to be a great cushion for the rest of the economy.
As oil prices have recovered from the mid-$30’s to to the current level of near $80 a barrel, oil has once again helped contribute to the growth of the trade deficit. More worrisome, though, is that now the non-petroleum side is showing an extremely sharp deterioration again.
It appears that the strength of the dollar in recent months due to the Euro crisis is already starting to take its toll on U.S. international competitiveness. It is not just that our trade deficit with Europe is deteriorating, rising to $7.8 billion in June from $6.2 billion in May. Our companies compete directly with European companies in many third-world countries.
For example, General Electric (GE) and Siemens (SI) of Germany both make products like MRI machines. If the value of the euro falls 10% against the dollar, then Siemens can easily undercut the price it quotes to a Chinese hospital that is interested in upgrading its medical imaging department, and thus get sales that might have otherwise gone to GE. China is, of course, our largest bilateral trade deficit, and it increased to $26.2 billion from $22.3 billion in May.
What We Need: A Weaker Dollar
We need to see the dollar weaken to get the non-oil part of the trade deficit under control. That will make U.S. goods more competitive abroad, and will also make imports more expensive. As a result, domestic producers like Ford (F) would take market share from foreign firms like Toyota Motors (TM), or as is more likely, firms like Toyota would move still more of their production to the U.S. rather than importing cars from Japan. Since oil is priced in dollars, it will tend to go up in price when the dollar gets weaker, so a weak currency will not really solve that part of the problem.
Even though the oil portion of the trade deficit has not been growing as fast as the non-oil part, it is still a very significant part of the overall picture. It seems unlikely that we will ever be able to really solve our overall trade deficit problem if we do not solve our oil addiction. As a country we are like a drug addict who is constantly selling off the family silver to feed his habit.
Unless the price of oil were to collapse to the very low levels that prevailed in the late 1990’s, the oil side of the equation is going to be a constant thorn in the side of the economy. After all, 42.5% of the overall deficit is still a very significant part of the problem.
That is probably putting it far too mildly. The trade deficit is more like a cancer on the economy. It is what leads the U.S. to be indebted to the rest of the world, not the budget deficit. After all, during WWII, the U.S. ran budget deficits that were far larger as a share of GDP than what we are running today, but we financed them internally, through the selling of war bonds. We emerged from the war as by far the world’s largest creditor, not in hock to the rest of the world.
Now we owe the rest of the world trillions, and our creditors are not really countries that have our best interests at heart, like China and the members of OPEC. Fortunately, the interest rate we have to pay on T-notes is very low right now, so the cost of carry is relatively low. But still, the interest that we pay that goes abroad is money that leaves the U.S. economy, rather than in the old days when it would mostly go to domestic creditors and would be spent here.
Cutting Back on Oil Use
For the most part, oil is used as a transportation fuel. Very little of it is used to generate electricity anymore. We need to find a way to cut back on the amount of oil we use for transportation. One way of doing this would be for us to move more of our goods by rail rather than by truck.
Probably the way this would be best accomplished would be for railroads to carry the goods for the long haul and then have the containers transferred to trucks for the last 50 miles of so of their journey. Not only are railroads much more fuel efficient than trucks, but this would also cut down on traffic congestion. Sitting in traffic jams wastes an enormous amount of oil each year.
Moving to more efficient cars would be a great help. However, as a nation, we suffer from Alzheimer’s. We have already seemed to have forgotten the pain of high oil prices two years ago. In July, as Detroit was rebounding from a year ago, it was sales of pickup trucks and SUVs that were leading the way, while small fuel efficient cars were languishing on the lots.
Most cars on the road usually have no, or at most just one, passenger in them. How much would our standard of living really be worse if people were driving smaller cars, and cars with four cylinders instead of six or eight? As the BP (BP) disaster in the Gulf has shown, the answer to our imported oil problem cannot really be “Drill, Baby, Drill,” at least not for oil.
Even with the deep waters of the Gulf of Mexico, the U.S. has only 2.1% of the world’s oil reserves. We already produce 8.5% of the world’s oil from that limited reserve base, which makes the U.S the world’s third largest oil producer after Russia and Saudi Arabia. The problem is that we consume 21.7% of the world’s oil. Anyone who thinks that we can solve the problem by increasing our share of production to match our consumption of 21.7% of the world total on just 2.1% of the worlds reserves is just plain off their rocker.
The Natural Gas Solution
Fortunately. there is a bit of a drilling solution. We hold vast reserves of natural gas, thanks to the emerging shale plays like the Marcellus in Pennsylvania and upstate New York. Compressed natural gas is used to power cars in many areas of the world, so it is not as if a new technology has to be developed to switch over.
It would require some effort to make refueling of natural gas powered vehicles easier. Very few people will buy a natural gas powered vehicle if they think they are likely to be stranded in the middle of nowhere unable to refuel. Gas stations are not going to invest in providing the ability refuel with natural gas if there are very few natural gas powered vehicles on the road.
Starting by shifting some of the truck fleet to natural gas might be the way to go, with incentives for the big truck stops along the highways to have natural gas available might be a way to start. Moving those fleet vehicles that return to a home base each night, like Federal Express (FDX) trucks and city buses to natural gas would also be a good way to start.
In addition to the benefit to the trade deficit, that would also have very big benefits in reducing the amount of CO2 the country emits. After all, left unchecked, the trade deficit will merely bankrupt us, but left unchecked global warming will destroy civilization.
Other Forward Steps We May Take
Command and control measures such as raising the CAFE standards on cars can help at the margin. The combination of high prices in 2008, a weak economy and people moving toward more fuel efficient cars (helped by the cash for clunkers program of a year ago) resulted in the U.S consuming 4.3% less oil in 2009 than we did in 2008. However, they will never really solve the problem, and are at best a very messy way of doing it.
We need to unleash the magic of the marketplace to really get at the heart of the problem. The best way to do that would be to put a price on the emission of carbon dioxide. There are two basic ways of doing that. The first and more straight forward approach is simply to impose a carbon tax on each fuel.
Since coal and oil have far more carbon per BTU than does natural gas, that would provide an incentive for companies to move to using more natural gas rather than oil or coal. People would be more interested in buying natural gas-powered (or electric with the electricity powered more by renewable sources and natural gas) cars than oil powered ones, and even if they preferred to stay with oil-powered cars, they would tend to prefer more efficient ones.
The second approach is a more roundabout way of doing the same thing: setting an overall limit on carbon emissions and then have companies bid for the right to emit that carbon. If companies were able to find low-hanging fruit to easily reduce their emissions, they could then sell their excess permits on the open market to those that did not have such opportunities. The revenues that the government would collect under such a method are the functional equivalent of a tax.
The cap-and-trade system was originally put in place by the first President Bush for sulfur dioxide, and it was extremely successful. SO2 levels in the atmosphere declined far faster than expected and at a far lower cost than was projected. In this country, acid rain is no longer a major environmental problem (it still is in places like China).
Given the weak economy, this big tax increase would need to be offset with tax reductions elsewhere in the economy. My first choice there would be to exempt say the first $50,000 a year from the payroll tax on both the employer and the employee and use the revenues raised by the carbon tax, either direct of indirect, to make up the difference so we do not hurt the long-term fiscal health of the Social Security system. That would have the added benefit of making it easier for employers to hire more people (the employer side) and would put some cash back into people’s pockets to offset the higher prices at the pump.
After all, if you tax something you get less of it. Why when we have unemployment at 9.5%, and underemployment far worse than that, does it make sense to tax payrolls instead of energy consumption that simply feeds the trade deficit and is in the process of destroying the very environment that we depend on to live?
Unfortunately, in the face of the warmest year on record — coming on the heels of the warmest decade on record, not just here in the U.S. but around the world — the threat of the filibuster has caused the Senate to drop consideration of any bill to address this problem.
In Summation: Bad News
This report was very bad news. I am far more concerned about the trade deficit than I am about the fiscal deficit, particularly for the short term. At least in the short term, the fiscal deficit provides stimulus that helps incease GDP growth. The trade deficit is nothing but a drag on the economy, and a very large and growing one at that.
The U.S. simply cannot continue to be the consumer of last resort for the rest of the world. If we do, it will not be long before the country is bankrupted and our living standards fall towards those of the developing world. This is a clear and present danger, but it does not seem to be getting the sort of attention it deserves.
BP PLC (BP): Free Stock Analysis Report
FORD MOTOR CO (F): Free Stock Analysis Report
TOYOTA MOTOR CP (TM): Free Stock Analysis Report

Leave a Reply