Crocs, Inc. (CROX) just hit a multi-year high after reporting better than expected Q2 results on Aug 5 that included a 61% earnings surprise. With a growing international presence and strong online sales, the company has capitalized on the improving consumer environment.
Company Description
Crocs, Inc. and its subsidiaries design and sell footwear for men, woman and children worldwide. The company was founded in 1999 and has a market cap of $1.57 billion.
Crocs, Inc. saw huge gains in its share price in 2006 and 2007 before the market crashed as the company’s unique shoes surged in popularity with young and old customers alike. But now, a few years down the road, shares of CROX are starting to show signs of life again, helped by the company’s better than expected Q2 results from August 5.
Second-Quarter Results
Revenue for the period was up 31% from last year to $228 million. Earnings also came in strong at 37 cents, 61% ahead of the Zacks Consensus Estimate, moving the company’s average earnings surprise over the last four quarters to 204%.
Although Internet sales represent a small portion of the company’s revenue mix, the segment stood out during the quarter with a 24% increase in sales to $22 million. Its retail outlets saw a 20% increase from last year to $66 million.
The Americas were still the strong region for the company in terms of both volume and growth, with sales up 23% to $104 million.
Complimenting the nice top-line growth, Crocs also continues to remain focused on cost management, pushing its gross margin to 58% from 51%.
Balance Sheet
Crocs also used the good quarter to strengthen its balance sheet, where its cash and equivalents gained 25% from last year to $97 million with no debt.
Estimates
Estimates took a nice jump on the good quarter, with the current year up 4 cents to 53 cents and the next year up 9 cents to 80 cents, a bullish 51% growth projection.
Valuation
With shares up big over the last year, the valuation picture is a bit rich with a forward P/E of 26X against its peers 13X.
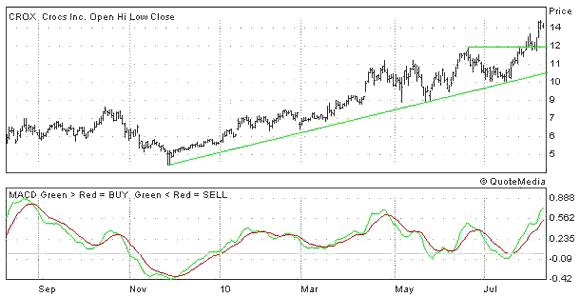
12-Month Chart
CROX recently hit a new multi-year high above $14 after jumping higher on the good quarter. Look for support from the trend line and previous breakout area on any weakness, take a look below.

Leave a Reply