Various housing “price” indices agree than the 2000s had a large housing cycle, with real housing values rising over a prolonged period, and then falling back close to their initial values in just a year or two. But they do not agree on the magnitude of the price boom, as shown in Table 1. The Table’s ten measures differ in terms of whether they compare same properties over time (Case-Shiller, Radar Logic, and OFHEO), or hedonically adjust new housing prices for measured characteristics (Census Bureau). Table 1 reveals how much of the difference among the same-property indices is related to their aggregation of the various cities or MSAs sampled, because the range of medians is only 10 percentage points, as compared to 38 percentage points for the national composites.
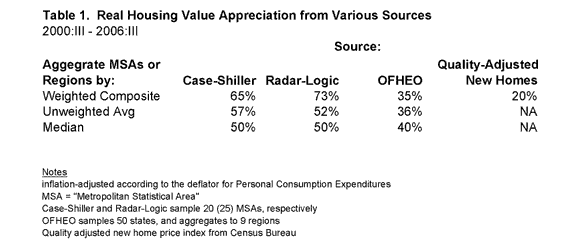
The Case-Shiller and Radar-Logic are commercially sponsored indices: it is possible that the MSAs sampled are not random with respect to the elasticity of housing supply (the sampled MSAs have less elastic supply than the un-sampled). Consistent with this hypothesis, the Case-Shiller composite-10 (the 10 MSAs they have followed longer) appreciates more than the Case-Shiller composite 20. For more research on reconciling various housing price indices, see some of these posts and the references cited therein:
C-S/OFHEO comparison from Professor Nunes
A New Comparative Analysis of Housing Price Indices
Regional shifts may cause housing prices to rise in some places and fall in others, so I take 40-50% as the size of the housing property value boom to be explained by national factors such as exuberance, monetary policy, or technical change. Moreover, “housing property values” are not the same as “housing prices” because the former also reflects changes in the quantity of housing on a given property and changes in land prices. Conceptually, the Census Bureau’s quality-adjusted index of new home prices could well be the best indicator of housing prices, and it shows a 20 percent housing price peak.
I think it’s safe to say that, from a national perspective, the housing price cycle involve peak housing price appreciation of 20-40 percent.
Disclaimer: This page contains affiliate links. If you choose to make a purchase after clicking a link, we may receive a commission at no additional cost to you. Thank you for your support!

The census looks at new homes, which is a very small share of all homes–particularly now. Their locations are also fundamentally different from existing homes.
As to value vs price, almost all of changes in price arise because of changes in land values (improvements generally depreciate in real terms), so I am not sure I understand the point of the distinction. All of the indexes do attempt to control for dwelling quality.