A lot has been made (here, for a recent example) of the idea that banks have shown a surprising amount of reluctance to extend credit and to start making loans again. Indeed, the Fed’s consumer credit report, which shows the aggregate amount of credit extended to individuals (excluding loans secured by real estate), has been on a steady downward trend since the fall of 2008.
Importantly, that report also provides a breakdown that shows how much credit the different types of institutions hold on their books. Commercial banks, which are the single largest category, accounted for about a third of the total stock in consumer credit in 2009. The two other largest categories—finance companies and securitized assets—accounted for a combined 45 percent. While commercial banks have been the biggest source of credit, they have not been the biggest direct source of the decline.
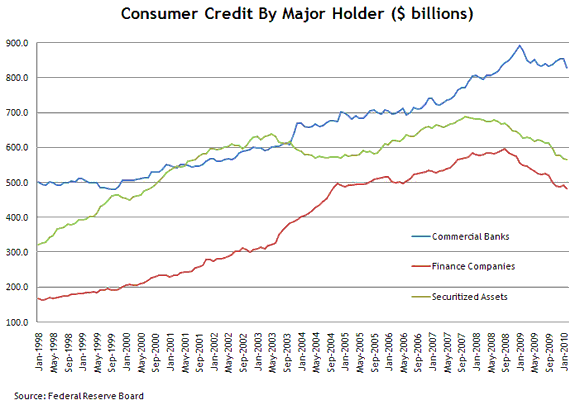
The chart above highlights a somewhat divergent pattern among the big three credit holders. This pattern mainly indicates that credit from finance companies and securitized assets has been on a relatively steady decline since the fall of 2008 while credit from commercial banks has shown more of a leveling off. These details highlight a potential misconception that commercial banks are the primary driver behind the recent reduction in credit going to consumers (however, lending surveys certainly indicate that standards for credit have tightened).
To put a scale on these declines, the aggregate measure of consumer credit has declined by a total of 5.7 percent since its peak in December 2008 through February 2010. Over this same time period, credit from finance companies and securitizations declined by 16.2 percent and 12.4 percent, respectively, while commercial bank credit declined by 5.5 percent. Admittedly, securitization and off-balance sheet financing are a big part of banks’ activity as they facilitate consumers’ access to credit. The decline in securitized assets might not be that surprising given that the market started to freeze in 2007 and deteriorated further in 2008 as many investors fled the market. Including banks’ securitized assets that are off the balance sheet would show a steeper decline in banks’ holdings of consumer credit.
A significant factor in evaluating consumer credit is the pace of charge-offs, which can overstate the decline in underlying loan activity (charge-offs are loans that are not expected to be paid back and are removed from the books). Some (here and here) have made the point that the declines in credit card debt, for example, reflect increasing rates of charge-offs rather than consumers paying down their balances.
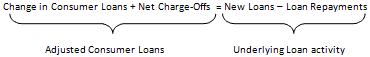
How much are charge-offs affecting the consumer credit data? Unfortunately, the Fed’s consumer credit statistics don’t include charge-offs. However, we can look at a different dataset that includes quarterly data on charge-offs for commercial banks to get an approximation. We can think of the change in consumer loan balances roughly as new loans minus loans repaid minus net loans charged off:
Change in Consumer Loans = [New Loans – Loan Repayments] – Net Charge-Offs
Adding net charge-offs to the change in consumer loans should give a cleaner estimate of underlying loan activity:
If the adjusted series is negative, loan repayments should be greater than new loans extended, which would lend support to the idea that loans are declining because consumers are paying down their debt balances. If the adjusted series is positive, new loans extended should be greater than loan repayments and adds support to the hypothesis that part of the decline in the as-reported loans data is from banks removing the debt from their books because of doubtful collection. Both the as-reported and adjusted consumer loan series are plotted here:
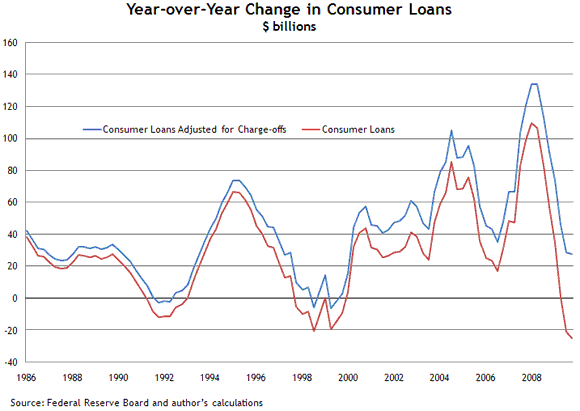
Notably, year-over-year growth in consumer loans adjusted for charge-offs has remained positive, which contrasts the negative growth in the as-reported series. That is, the net growth in new loans and loan repayments shows a positive (albeit slowing) growth rate once charge-offs are factored in. Over 2009, this estimate of charge-offs totaled about $27 billion while banks’ average consumer loan balances declined by about $25 billion. Thus, a significant portion of the recent decline in consumer loan balances is the result of charge-offs.
Nevertheless, in an expanding economy, little or no credit growth implies a declining share of consumption financed through credit. Adjusting consumer loans for charge-offs suggests that the degree of consumer deleveraging across nonmortgage debt is somewhat less substantial than indicated by the headline numbers.
All in all, the consumer credit picture is a bit more complicated than it appears on the surface. A more detailed look suggests that banks haven’t cut their consumer loan portfolios as drastically as sometimes assumed. The large run-up in charge-offs has also masked the underlying dynamics for loan creation and repayment. Factoring in charge-offs provides some evidence that a nontrivial part of consumer deleveraging is coming through charge-offs.
Disclaimer: This page contains affiliate links. If you choose to make a purchase after clicking a link, we may receive a commission at no additional cost to you. Thank you for your support!

Leave a Reply