What do current financial indicators tell us about where the economy is headed?
Macroeconomists have long observed that changes in financial indicators often presage future changes in the economy. For example, a big gap between yields on long-term relative to short-term bonds often signals that faster real economic growth is coming, while an increase in the spread between risky and safer yields is often observed prior to an economic downturn. Stock prices and yield spreads are both used by the Conference Board’s index of leading economic indicators.
Most recently, researchers have tried to gauge the degree of financial stress using indicators such as the LIBOR-OIS spread ([1], [2]) or deviations of yields from predictions of interest rate models (e.g., the recent paper by Christensen, Lopez, and Rudebusch). There are also a number of composite indexes that various private-sector analysts rely on, such as the Bloomberg financial conditions index.
Two private-sector analysts (Jan Hatzius of Goldman Sachs and Peter Hooper of Deutsche Bank) have recently teamed up with three academics (Rick Mishkin of Columbia, Kermit Schoenholtz of NYU, and Mark Watson of Princeton) to produce a new financial conditions index that attempts to combine the information of 44 separate series including those mentioned above along with a great number of others. One of the differences between their approach and previous work is that HHMSW seek to isolate the separate information of the financial indicators from aggregate business cycle movements by looking at the residuals from a regression of each indicator on lags of inflation and real GDP growth rates. The researchers then extracted a variable similar to a principal component from the residuals across the 44 indicators. HHMSW demonstrate that the resulting series can be quite helpful for predicting real GDP growth, though there is evidence that these predictive relations may change over time.
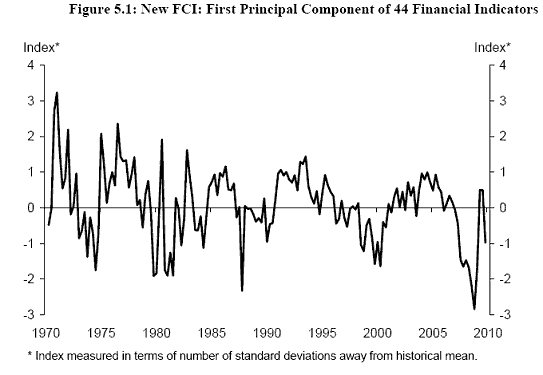
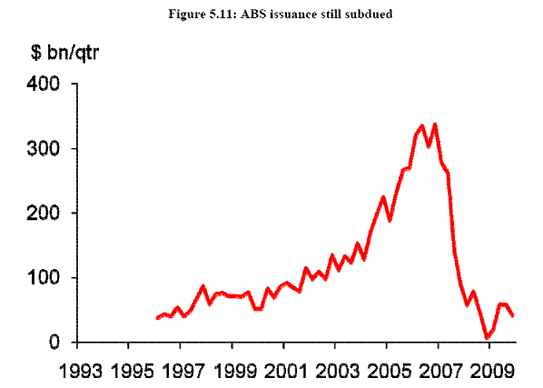
Of particular interest at the moment is the fact that the HHMSW index, unlike most other indicators, shows a renewed deterioration subsequent to the initial recovery in the first part of 2009, a somewhat surprising result given the current steeply-sloping yield curve, low TED spread, and booming stock market. The surprising contrary inference from the HHMSW index appears to be due to two factors. First, the HHMSW index is based on the deviation of the financial indicators from what one would have predicted given recent economic conditions. Many indicators have not improved as much as one would have expected given the return to GDP growth, and the departure from a typical recovery pattern is viewed by the index as a highly pessimistic development. Second, the HHMSW index makes use not just of the yields themselves but also of the quantities of various assets, and many of these show little improvement so far. For example, issuance of new asset-backed securities remains quite low.
Will real GDP follow the HHMSW index back down? That’s not what I’m expecting. But if it does, it wouldn’t be the first time I’ve been wrong.
Charts: Hatzius, et. al.
A new index of financial conditions
Disclaimer: This page contains affiliate links. If you choose to make a purchase after clicking a link, we may receive a commission at no additional cost to you. Thank you for your support!

Leave a Reply