James MacGee has an interesting article that compares the post-housing boom period in Canada with that of the United States (hat tip James Hamilton). Specifically, he notes that the housing bust that took place in the United States did not occur in Canada and attempts to explain this difference by looking at the two most common reasons given for the housing boom:
- loose monetary policy and
- relaxed lending standards
Looking at both factors, MacGee makes the following observations:
The similarity of the impact of monetary policy and the absence of a housing market bust in Canada suggest that some other factor must have been present in the U.S. to generate the boom and bust. This is not to suggest that “loose” monetary policy did not put upward pressure on housing prices—indeed, both Canada and the U.S. experienced substantial levels of house price appreciation. However, the Canada-U.S comparison suggests that some other factor drove both the more rapid house appreciation and set the groundwork for a U.S. housing bust.
MacGee’s claim that monetary policy in the two countries were similar is based on the fact that both policy interest rates followed similar paths during the housing boom (see his central bank target rate figure). Since these indicators of monetary policy did not differ much, he concludes it must be the case that the distinguishing factor between the two countries were the lax lending standards in the United States. I certainly agree that the monetary policy was not the only factor in the housing boom. I hesitate, however, to conclude that because the policy interest rates followed similar paths the stances of monetary policy were also similar. As Nick Rowe points out its not the level of the policy interest rate but where it is relative to the natural interest rate that determines the stance of monetary policy. Consequently, to make a convincing case that monetary policy was similar in Canada and the United States during this time one needs to show the difference between the natural interest rate and the policy interest rate–called the policy rate gap hereafter–for both countries followed similar paths.
So what does the policy rate gap show? It is not easy to answer this question because it requires an estimate of the natural rate of interest for both countries. I am only aware of natural interest rate estimates for the United States covering the housing boom period. Therefore, let me approximate the idea of a natural rate of interest–and will latter corroborate this approach–by looking at the growth rate of labor productivity in both countries relative to the policy interest rate. The natural interest rate, after all, is a function of individuals’ time preferences, productivity, and the population growth rate. Of these three components, the one that seems to have changed the most during the housing boom in the United States was productivity. Below is a figure showing the quarterly year-on-year growth rate of labor productivity minus the ex-post real policy interest rate for both countries. (The policy rate in Canada is the overnight rate and in the United States it is the federal funds rate. The ex-post real federal funds rate is used to make a consistent comparison since I could not find quarterly inflation forecasts for Canada.) A positive gap indicates accommodative monetary policy while a negative gaps indicates tightness.
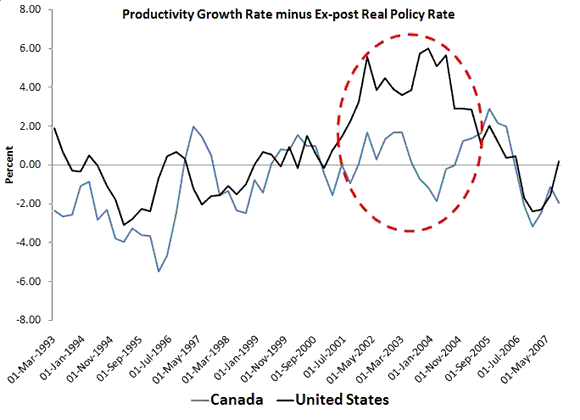
This figure reveals a large policy rate gap for the United States while for Canada it shows one hovering around zero. The figure indicates, then, that monetary policy was not the same in both countries. The Canadian monetary authorities got it about right while the Fed was too accommodating. Now in case you are not convinced that this measure is truly approximating the difference between the natural interest rate and the ex-ante real policy interest rate I have constructed the actual policy rate gap measure for the United States as a comparison. The natural interest rate data comes from this paper by Fed economists John C. Williams and Thomas Laubach while the ex-ante real federal funds rate is constructed by subtracting from the federal funds rate the inflation forecasts from the Philadelphia Fed’s Survey of Professional Forecasters. The figure below graphs the two U.S. policy rate gap measures:
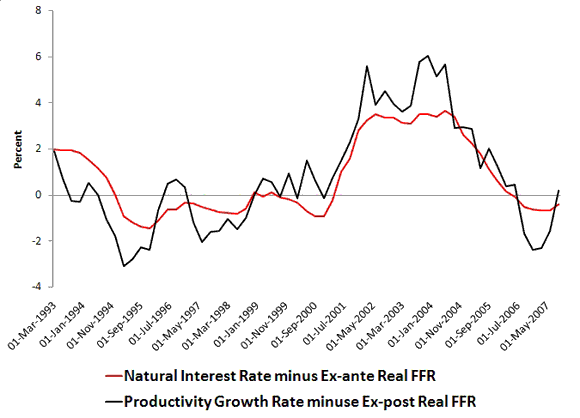
The similarity of these two series indicates the productivity-based approximation of the policy rate gap does a decent job. The low interest rates in the United States, then, appear to have been more distortionary than those in Canada.
So what is the take away from this analysis? For starters, monetary policy was an important part of the U.S. housing boom-bust cycle. Moreover, it is possible that the relaxed lending standards themselves cannot be entirely separated from this loose monetary policy. Over at Econbrowser commentator David Pearson sums it up nicely:
Weak underwriting standards and the “Greenspan Put” were joined at the hips. What you call weak underwriting was actually just collateral-based lending (hence no-doc loans basically eliminated ability to pay as a criterion, and zero-down loans depended entirely on the creation of equity value through appreciation). Where did the confidence come from to adopt widespread collateral-based lending? I believe a great deal of it came from the Fed’s asymmetric monetary policy. Remember, the underwriting standards were ultimately set by the volume of demand (from hedge funds and the like) for higher-yielding securitizations, and, in turn, that demand was generated by ultra-low interest rates at the short end…
I would also note that during the housing boom interest rates charged to non-conventional mortgages were closely tied to the federal funds rate as seen in the figure below (see this post for more on this point.)
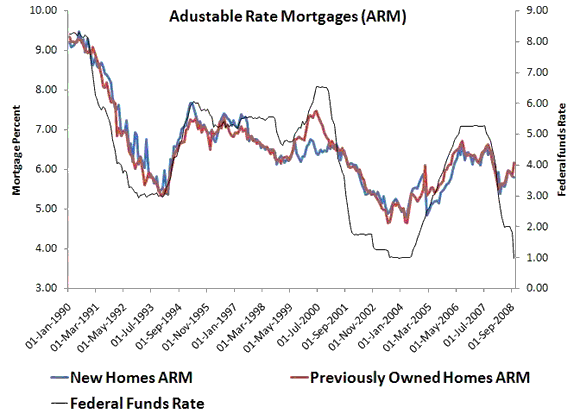
Source: FHFA
Of course, none of this is new. John Taylor already showed us via his Taylor Rule that those countries that deviated the most from the Taylor Rule’s tended to have the greatest housing booms.
Disclaimer: This page contains affiliate links. If you choose to make a purchase after clicking a link, we may receive a commission at no additional cost to you. Thank you for your support!

Leave a Reply