The past three weeks have been interesting to watch as the Dow (DIA ETF) has broadened causing traders to be shaken in and out of positions. Commodities have been under pressure as the US dollar has risen. Below are some charts of these investments and what I think could happen in the next couple weeks.
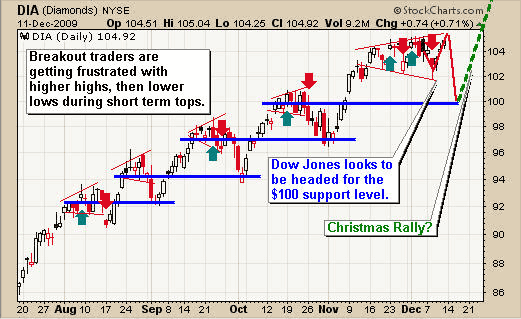
DIA – Exchange Traded Fund
As you can see the broadening formation is bearish as it results in a short term pullback. This type of price action is what frustrates breakout and novice traders. As traders jump into positions once the previous high is broken, they hope for a rally. Instead the market briefly moves higher then reverses and moves down to penetrate the previous pivot low. This is where breakout traders place their stops and as the market knows this, it obliges by moving below this level to shake out these traders before it rallies again.
That being said, it looks like stocks could make a new high this week, just enough to suck in more short term breakout traders before rolling over once again to test a deeper support level. A pullback to the $99-100 level would make for a great buy point.
Diamonds Trust, Series 1 (DIA)
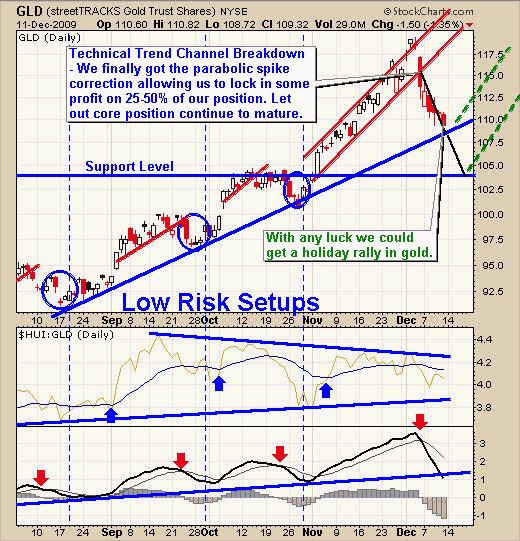
GLD – Gold Exchange Traded Fund
The strengthening dollar is putting pressure on precious metals with gold testing the first support level. Depending on what the dollar does in the coming days we could see gold test the second support level.
In my opinion gold can test the second support level without triggering any major sell signals for traders and investors. The trend will still be up and it is important to know the horizontal support level is more important than a trend line support level.
SPDR Gold Trust (GLD)
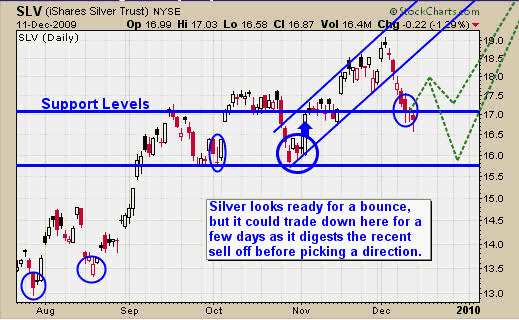
SLV – Exchange Traded Fund
Silver is in the same boat at gold. Only time will tell if we get a bounce or a further test lower. Either way, the underlying trend is still up and we will be able trade it.
iShares Silver Trust (SLV)
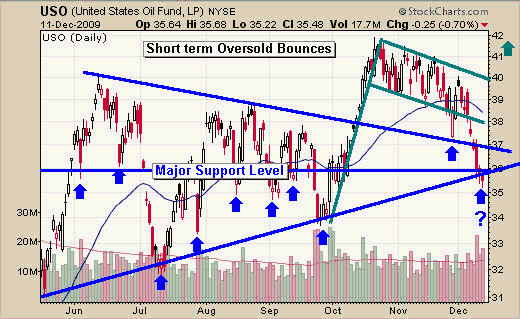
USO – Oil Exchange Traded Fund
Oil broke down out of its bull flag last week and is currently testing both trend line support and horizontal support levels. We could see a short term bounce here to the $37, 38 or 40 levels. Taking money off the table at each resistance level and raising your stop is an important money management strategy I use for this type of play.
This is a high risk type of play which I am not taking part in. But I do find it fun to track plays like this for educational reasons.
United States Oil Fund LP (USO)
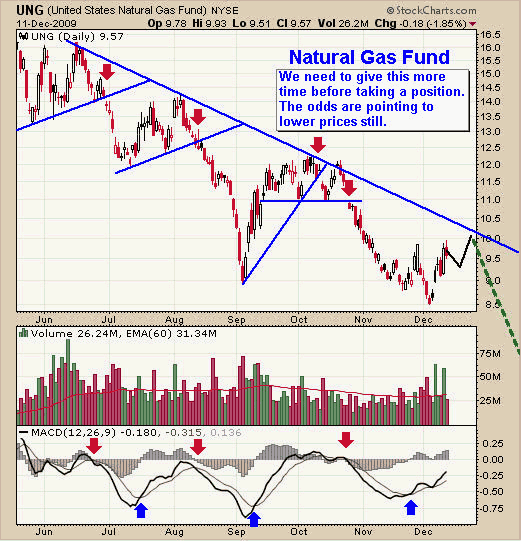
UNG – Natural Gas Exchange Traded Fund
The natural gas fund is a touchy topic with so many traders. I get emails every day asking why I trade UNG because of the contango and the fact that so many people have lost money with it; they don’t want to touch it again. My answer is very simple, it works perfectly fine for short term trading which lasts 1-20 days. “If it works, Don’t Fix It”.
I do agree UNG is tougher than other ETFs to trade, but it still makes money and that is what our goal is.
Anyways natural gas has found some support and is bouncing around. We could see it trend sideways or up until a test of our blue resistance trend line is reached. From there we can asses the situation for a possible trade.
The underlying trend is down on the monthly and weekly charts so do not get too excited about going long anytime soon.
United States Natural Gas Fund, LP (UNG)
ETF Trading Conclusion:
Overall the market feels a little top heavy and the price action on the charts are saying the same thing. My short term indicators are telling me the Dow (DIA fund) is over bought and ready for a couple days of selling. With any luck we will see a test of support which will flush out most short term traders this week, then a nice low volume rally going into Christmas. On the other hand, the market has been holding up well and prices could continue to drift higher from here. If that is the case we simply continue to hold our current long positions and enjoy the ride.
Silver and gold are testing support levels and if the market continues to rally here, I figure precious metals will follow. But if we see stocks pull back and test support, then we will most likely see the metals pull back further also.
Crude oil has formed a scary looking chart as it flushes out traders on this recent drop. My general rule for spec plays is to buy when the chart looks scary, but is trading at multiple support levels. It is very difficult to buy at these levels but as my good buddy David Banister from ActiveTradingPartners.com always says, “Buy when they Cry, Sell when it’s Loud”. Meaning buy when everyone is panicking out of their positions, and sell when everyone is buying into the move usually seen by high volume levels and much higher prices.
Natural Gas is jumping around like crazy. We continue to wait for a tradable price pattern to form in conjunction with a support or resistance level to help put the odds more on our side.
Disclaimer: This page contains affiliate links. If you choose to make a purchase after clicking a link, we may receive a commission at no additional cost to you. Thank you for your support!


Leave a Reply