…and an initial read on monthly GDP.
First, note that nonfarm payroll employment has flattened out, at least according to this initial estimate for November. Previous months figures have been revised upward. In the figure below, I present the September as well as November release.
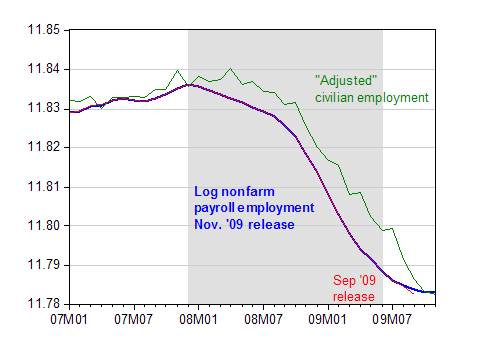
Figure 1: Log nonfarm payroll employment, November release (blue), September release (red), and civilian employment smoothed, adjusted to conform to NFP concept (green). NBER defined recession dates shaded gray, assuming recession ends in 2009M06. Source: BLS, via FREDII, BLS, and NBER.
Interestingly, the BLS’s alternative series, adjusting the household survey based employment series to conform to the NFP concept, indicates the same level of employment, although it seems to be continuing its decline at a slightly more rapid pace than NFP.
Second, private employment has apparently flattened out as well, while private aggregate weekly hours have actually risen.
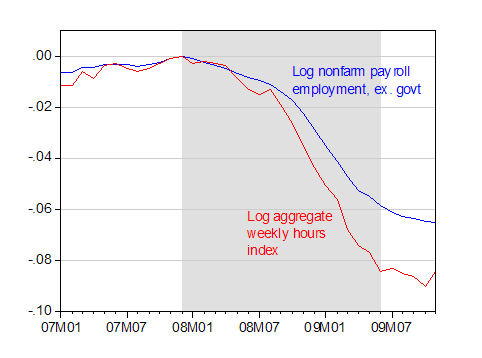
Figure 2: Log NFP ex.-government, (blue) and log aggregate weekly hours in private sector (red), both relative to 2007M12. NBER defined recession dates shaded gray, assuming recession ends in 2009M06. Source: BLS via FREDII and NBER.
Third, government employment actually rose. While this is true, government employment is actually down by about half a percentage point relative to April 2009.
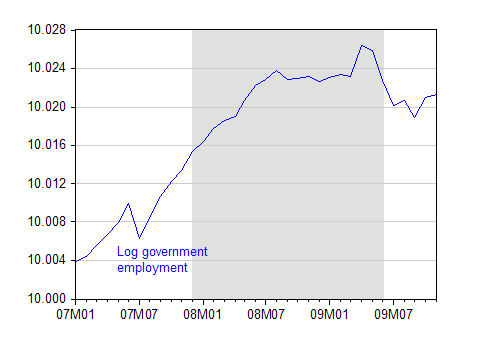
Figure 3: Log government employment (blue). NBER defined recession dates shaded gray, assuming recession ends in 2009M06. Source: BLS via FREDII.
The latest reading from e-forecasting on monthly GDP indicates continued increase in November.
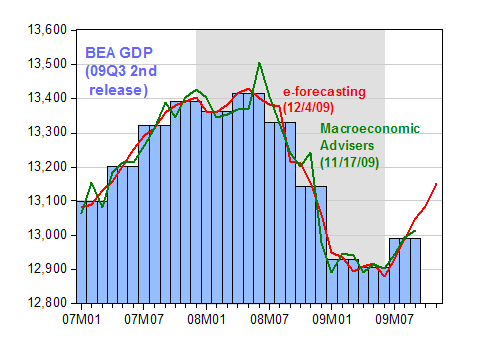
Figure 4: Log real GDP, 2nd release for ’09Q3, SAAR (blue bars), e-forecasting release of 4 December (red line), and Macroeconomic Advisers release of 17 November (green line). NBER defined recession dates shaded gray, assuming recession ends in 2009M06. Source: BEA, e-forecasting, Macroeconomic Advisers and NBER.
All these observations subject to the caveat that the November employment figures will be revised next month (and again revised with the incorporation of the comprehensive benchmark revisions). The e-forecasting first estimates are, in my experience, subject to substantial revisions, as additional information regarding the relevant month comes in.
The Employment Situation in Graphs
Disclaimer: This page contains affiliate links. If you choose to make a purchase after clicking a link, we may receive a commission at no additional cost to you. Thank you for your support!

Leave a Reply