During the last two years, the Federal Reserve responded to problems in the financial markets through what I have described as monetary policy using the asset side of the Fed’s balance sheet, replacing its traditional holdings of Treasury securities with a variety of new lending programs and alternative assets. I’ve been taking a look at what effect these operations seem to have had on the problems they were designed to address.
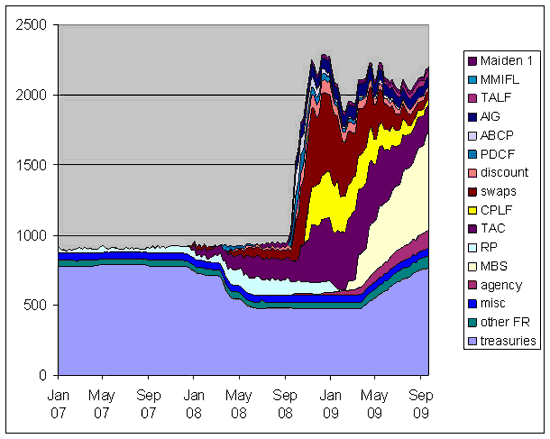
Federal Reserve assets, in billions of dollars, seasonally unadjusted, from Jan 1, 2007 to September 23, 2009. Wednesday values, from Federal Reserve H41 release. Agency: federal agency debt securities held outright; swaps: central bank liquidity swaps; Maiden 1: net portfolio holdings of Maiden Lane LLC; MMIFL: net portfolio holdings of LLCs funded through the Money Market Investor Funding Facility; MBS: mortgage-backed securities held outright; CPLF: net portfolio holdings of LLCs funded through the Commercial Paper Funding Facility; TALF: loans extended through Term Asset-Backed Securities Loan Facility; AIG: sum of credit extended to American International Group, Inc. plus net portfolio holdings of Maiden Lane II and III; ABCP: loans extended to Asset-Backed Commercial Paper Money Market Mutual Fund Liquidity Facility; PDCF: loans extended to primary dealer and other broker-dealer credit; discount: sum of primary credit, secondary credit, and seasonal credit; TAC: term auction credit; RP: repurchase agreements; misc: sum of float, gold stock, special drawing rights certificate account, and Treasury currency outstanding; other FR: Other Federal Reserve assets; treasuries: U.S. Treasury securities held outright.
Rather than trying to sort out which of the asset-side actions by the Fed were most effective, I was curious to see what conclusions emerge if you just lump all the Fed’s targeted liquidity measures together, as proxied by the difference between the Fed’s total assets and its holding of conventional Treasury securities. Thus for purposes of the discussion below I propose to measure the overall magnitude of targeted liquidity actions by the sum at any given date of everything other than the light blue area in the graph above.
One indicator of the financial stress to which the Fed was responding is the gap between the 3-month LIBOR rate and the 3-month T-bill rate, often described as the TED spread. This spread went through a series of four dramatic waves over the last two years. I looked at each of these four surges in the TED spread as potential case studies for the effects that targeted liquidity actions might have.
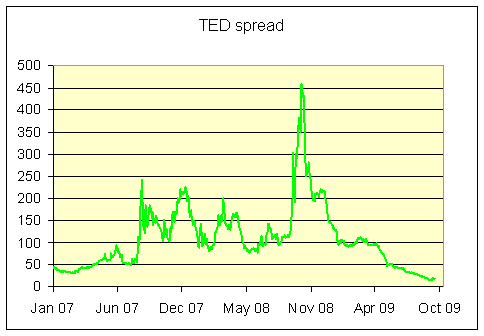
3-month LIBOR rate minus 3-month T-bill rate, in basis points, January 2007 to September 2009. Data from Webstract.
The first episode began with the freezing of BNP Paribus assets on August 9, 2007, subsequent to which the TED spread reached a peak of 242 basis points on August 20. Targeted liquidity operations consisted only of a quite minor and temporary expansion of repos and discount borrowing. The sole special action by the Fed that made it onto the New York Fed’s Financial Turmoil Timeline is an announcement by the Fed on August 10 that it would provide liquidity as needed. It seems safe to conclude that in this case, interest rate spreads rose in spite of the Fed announcement, and eased for reasons other than an increase in the volume of targeted liquidity operations by the Fed.
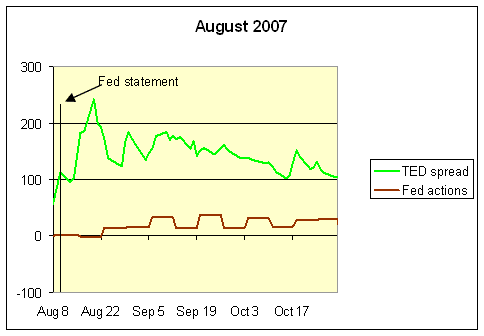
Brick line: cumulative targeted Fed liquidity actions subsequent to August 8, 2007, as measured by (a) total Fed assets net of Fed Treasury holdings on Wednesday of indicated week minus (b) total Fed assets net of Fed Treasury holdings as of August 8 in billions of dollars. Green line: TED spread at indicated date, in basis points. Black line: August 10, 2007.
The second episode occurred in the fall of 2007 as problem bank assets became acknowledged. Taylor and Williams pointed to the fact that the TED spread turned down well before targeted liquidity operations were cranked up as evidence that the latter were not the cause of the former. However, Christensen, Lopez and Rudebusch noted that the Fed announced its intention to make aggressive use of the Term Auction Facility and currency swaps on December 12. The TED spread peaked at 225 basis points on December 12, and fell steadily after the Fed’s announcement. This episode could thus be viewed as consistent with the claim that targeted Fed liquidity measures are a potentially powerful tool for changing this interest rate spread, so much so that simply announcing their intended implementation can have dramatic effects.
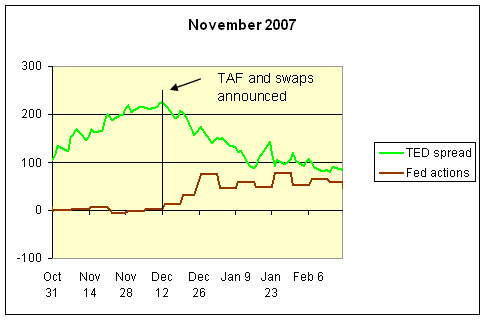
Brick line: cumulative targeted Fed liquidity actions subsequent to October 31, 2007, as measured by (a) total Fed assets net of Fed Treasury holdings on Wednesday of indicated week minus (b) total Fed assets net of Fed Treasury holdings as of October 31 in billions of dollars. Green line: TED spread at indicated date, in basis points. Black line: December 12, 2007.
In the spring of 2008, the TED spread exhibited a similar spike. In this case the magnitude of the Fed’s targeted liquidity operations eventually grew to three times the size of what it had implemented in December. The Fed announced its new Primary Dealer Credit Facility on March 16 and also significantly expanded its repo positions and Term Auction Credit over the next several weeks. The TED spread peaked at 200 basis points on March 19. Christensen, Lopez and Rudebusch chose March 24, the date of Bear Stearns’ rescue, as the key turning point, after which risk spreads became significantly lower than their model predicts they otherwise would have been.
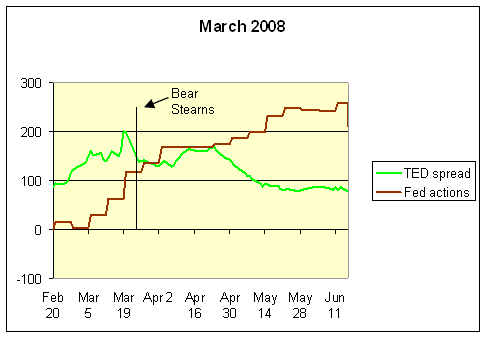
Brick line: cumulative targeted Fed liquidity actions subsequent to February 20, 2008, as measured by (a) total Fed assets net of Fed Treasury holdings on Wednesday of indicated week minus (b) total Fed assets net of Fed Treasury holdings as of February 20 in billions of dollars. Green line: TED spread at indicated date, in basis points. Black line: March 24, 2008.
These actions were in turn dwarfed by steps adopted in the fall of 2008; note the scale on the vertical axis in the diagram below is five times as big as that in the previous three graphs. There were so many new Fed measures adopted at this time that it would be hopeless to single out any one. I’ve indicated Lehman’s September 15 filing for bankruptcy as one important reference date on which we could all agree in the diagram below. Targeted Fed liquidity operations increased by $691 billion between September 3 and October 8, despite which the TED spread rose from 114 to 385 basis points and would continue to rise until peaking at 458 basis points on October 10. By November 12 nonstandard Fed assets had expanded by $1312 billion.
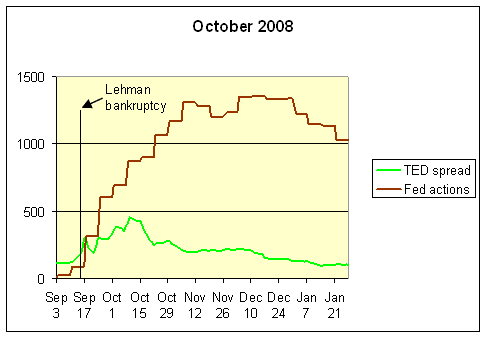
Brick line: cumulative targeted Fed liquidity actions subsequent to September 3, 2008, as measured by (a) total Fed assets net of Fed Treasury holdings on Wednesday of indicated week minus (b) total Fed assets net of Fed Treasury holdings as of September 3 in billions of dollars. Green line: TED spread at indicated date, in basis points. Black line: September 15, 2008.
To get a sense of the overall connection between targeted liquidity actions and the TED spread over this period, we can look at a scatter plot such as that shown below. Each square in this plot corresponds to a particular week over the period January 10, 2007 through September 16, 2009. The horizontal axis represents the change in targeted liquidity operations over that week, while the vertical axis records the change in the TED spread over that week. If we thought that the correlation between these two variables resulted from the effects of liquidity operations on the spread, we would have expected a negative correlation– when the Fed expands its balance sheet, the intention is to bring the spread down rather than up. In fact the regression line relating the two variables has a positive slope– if the Fed expanded its balance sheet in a given week, the TED spread was more likely to go up rather than down that week, though the slope is statistically indistinguishable from zero.

Horizontal axis: (a) total Fed assets net of Fed Treasury holdings on Wednesday of a given week minus (b) total Fed assets net of Fed Treasury holdings as of the previous Wednesday. Vertical axis: Wednesday-to-Wednesday change in TED spread for the same week. Straight line: regression relation. Sample period: January 10, 2007 to September 16, 2009.
Of course, the reason that the line slopes up rather than down is that the correlation does not simply reflect the response of the economy to the Fed’s actions. It also results from the response of the Fed to the economy. Specifically, when the TED spread increased, the Fed responded by increasing its targeted liquidity operations. Presumably it is this endogenous response by the Fed that produces the overall positive correlation in the data. This is a familiar problem in interpreting statistical correlations, and unfortunately it is difficult for any method to resolve. All we can say is that, presumably because of this endogeneity of the Fed’s response, a beneficial effect of targeted liquidity operations on credit spreads is not the dominant feature one sees in the data.
Or to put it another way, it’s not that we saw that things got better whenever the Fed expanded its targeted liquidity operations. Instead the most we could claim that if the Fed had not implemented its actions, things would have been much worse.
Disclaimer: This page contains affiliate links. If you choose to make a purchase after clicking a link, we may receive a commission at no additional cost to you. Thank you for your support!

well said…the results I see here and other statistical data is a lack of purity….so cause and effect are unclear, therefore open to interpretation. thus, increase room for bias or other errors.
ted spread or vix, libor etc are all becomming clouded with unpure influences. one must be cautious to their meanings…