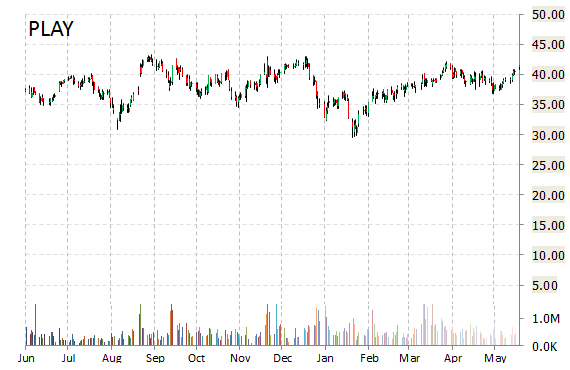
Dave & Buster’s Entertainment, Inc. (PLAY) reported first quarter non-GAAP EPS of $0.72 after the closing bell Tuesday, compared to the consensus estimate of $0.59. Revenues increased 17.6% from last year to $262 million. Analysts expected revenues of $251.42 million. The company guided FY17 revenues of $983-$995 million, as compared to analysts’ expectations of $982 million.
The stock is currently up $2.24 to $44.10 on 2.21 million shares.
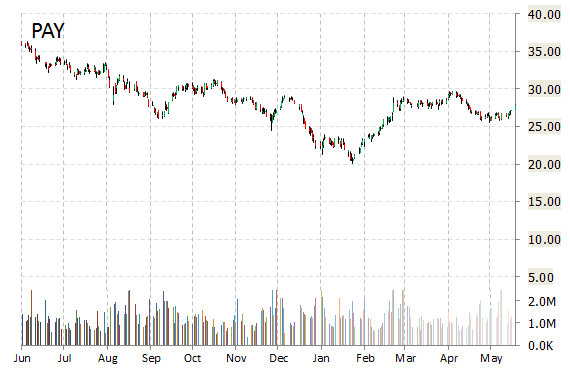
Shares of VeriFone Systems, Inc. (PAY) are down $7.83 to $20.40 after the company reported second-quarter earnings of $532 million or $0.47 per share. Analysts had been modeling $530.07 million and $0.52 per share. For Q3, PAY provided EPS guidance of $0.40 versus consensus of $0.59 per share. The company also issued revenue projection of $515 million, compared to the consensus revenue estimate of $551.34 million.
On valuation measures, VeriFone Systems Inc. shares, which currently have an average 3-month trading volume of 1.36 million shares, trade at a trailing-12 P/E of 36.71, a forward P/E of 11.07 and a P/E to growth ratio of 0.83. The median Wall Street price target on the name is $36.00 with a high target of $40.00. Currently ticker boasts 15 ‘Buy’ endorsements, compared to 5 ‘Holds’ and no ‘Sell’.
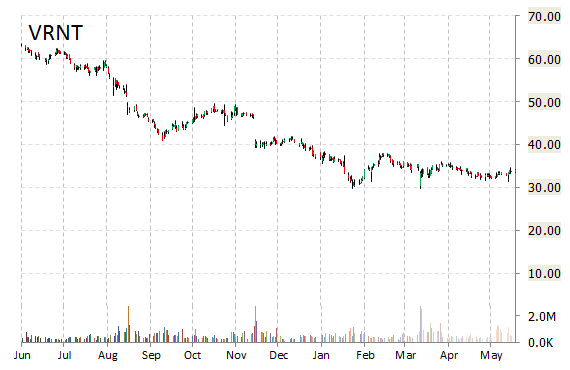
Verint Systems Inc. (VRNT) shares are down $1.29 to $33.75 in after-hours trading Tuesday after the company reported its first quarter earnings results.
The firm reported non-GAAP EPS of $0.46 on revenues of $249 million, down 7.9% from a year ago. Analysts were expecting EPS of $0.41 on revenues of $250.66 million. The company guided FY17 revenues of $1.11-$1.16 billion, as compared to analysts’ expectations of $1.13 billion. The management also gave its bottom line range of $3.04 per share, against projections of $3.04 per share.
Profitability-wise, VRNT has a t-12 profit and operating margin of 1.56% and 6.63%, respectively. The $2.18 billion market cap company reported $408.09 million in cash vs. $738.09 million in debt in its most recent quarter. VRNT currently prints a one year loss of about 46.72% and a year-to-date loss of around 15.75%.

Leave a Reply