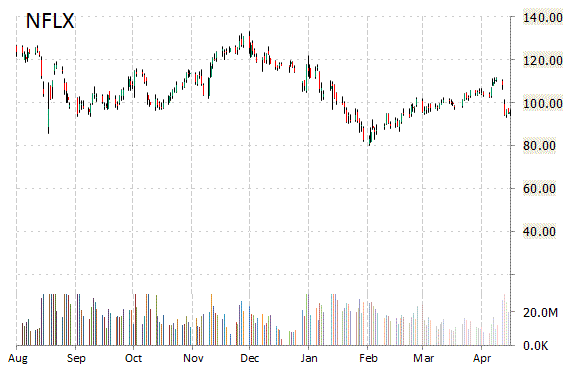
Netflix, Inc. (NFLX) reported first-quarter EPS of $0.06 after the closing bell Monday, compared to the consensus estimate of $0.03. Revenues increased 24.5% from last year to $1.96 billion. Analysts expected revenues of $1.97 billion. Subscriber growth in January through March was 6.7 million new subscribers, 2.23 million in the U.S. and 4.51 million internationally. Neflix’s forecast was for an addition of 6.1 million net subscribers.
Looking ahead to the second quarter, the video streaming service provided Q2 EPS guidance of $0.02 versus consensus of $0.05 per share. The name plunged by more than 10 percent to $97.02 in after-hours trading after the results were announced.
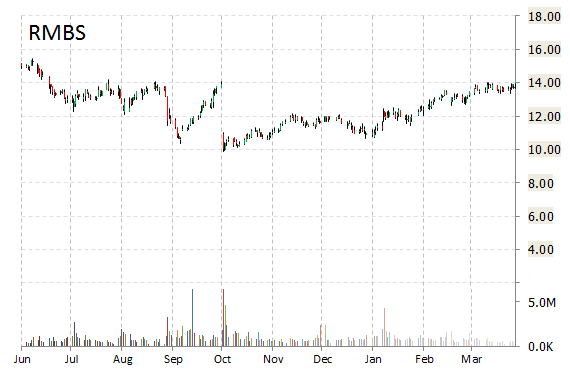
Rambus Inc. (RMBS) dropped $1.42 to $12.35 in after-hours trading after it reported fiscal results for the first quarter.
In its quarterly report, the manufacturer of semiconductor and IP products said it earned $0.13 per share, one penny above the $0.12 per share analysts were expecting. Revenue fell 0.3% to $72.7 million, below views for $73.25 million.
For the current quarter ending in July, the Sunnyvale, Calif.-based company said it expects revenue in the range of $72 million to $77 million, compared to analysts’ expectations of $78.73 million.
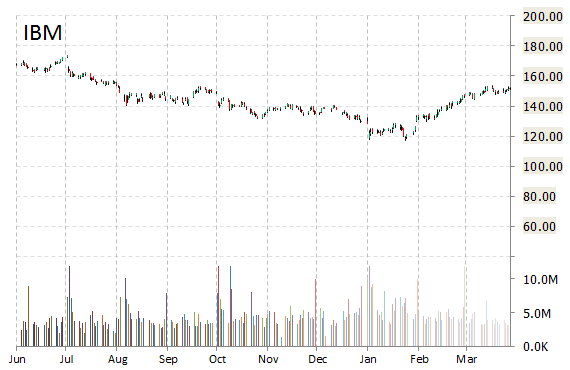
International Business Machines Corporation (IBM) dropped $3.38 to $149.15 in after-hours trading after it reported fiscal-first quarter earnings.
The provider of IT products and services worldwide handed in non-GAAP earnings of $2.35 per share on revenue of $18.68 billion, beating Wall Street estimates of $2.09 per share on revenue of $18.28 billion.
IBM said it expects full fiscal 2016 earnings to be $13.50 per share.
Profitability-wise, IBM has a t-12 profit and operating margin of 16.14% and 19.85%, respectively. The $146.56 billion market cap company reported $14.9 billion in cash in its most recent quarter. It generated free cash flow of $2.3 billion.
IBM currently prints a one year loss of 3.65% and a year-to-date return of around 11.5%.
The chart below shows where the equity has traded over the last 52 weeks.


Leave a Reply