It’s been awhile since I did an article showing the latest revised charts by the St. Louis Fed. So, here is a collection of charts showing the underpinnings of our economy. Please pay attention to the left hand scale of the chart as some are expressed in raw billions while others are expressed in year over year (yoy) percent change.
BANKING & CREDIT:
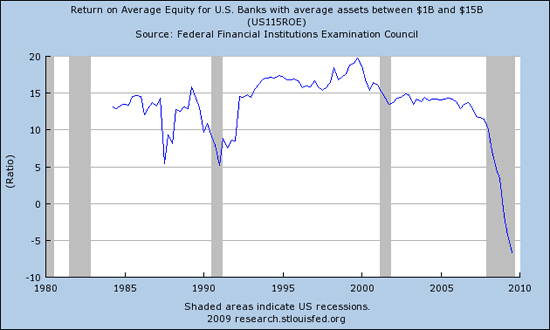
Return on average equity for banks with assets from $1B to $15B… these are middle sized banks, both the larger and smaller banks charts show the same type of picture. So, where are the real bank profits? The only profits they are actually making is on paper, the result of mark to fantasy accounting because the FASB caved into pressure from Congress who in-turn caved into pressure from the central bankers:
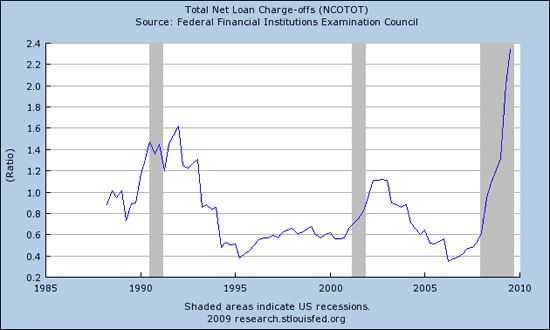
Total net loan charge offs… this is for all loans. Still no greenshoots here, the banks have been reticent to write off bad loans. They are still holding inventory in hopes of price recovery that will never happen and thus the end of charge offs is nowhere near complete as the trajectory of this chart clearly shows:
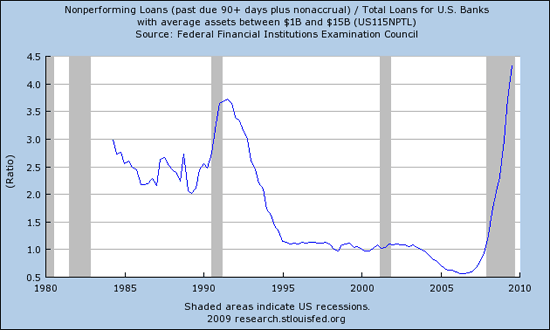
Of course, the number of loans not performing is skyrocketing and is NOT letting up:
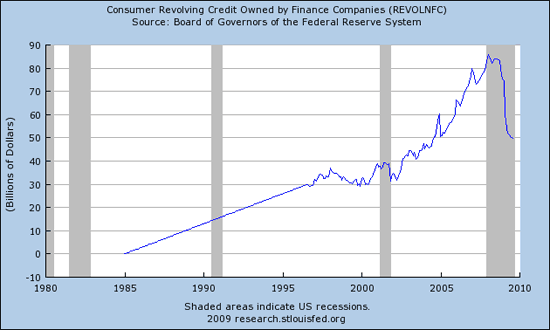
Revolving credit (primarily credit cards) is down significantly in terms of raw dollars… total consumer credit comes out this afternoon:
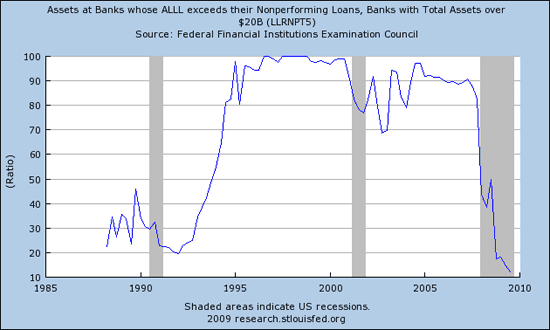
I’ve gone over what ALLL is before… it’s the Allowance for Loan and Lease Losses. The higher the allowance the better, low is bad… and right now the allowance for losses has never been smaller! This chart is for banks over $20 billion, ALLL is in the gutter meaning that banks do not have the cushion normally required. No surprise, then, that banks are failing. Where are the regulators and what are they doing? Good question:
GOVERNMENT:
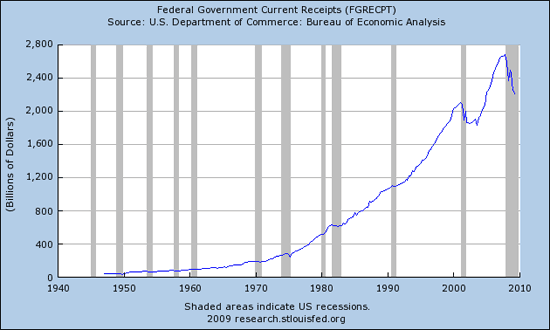
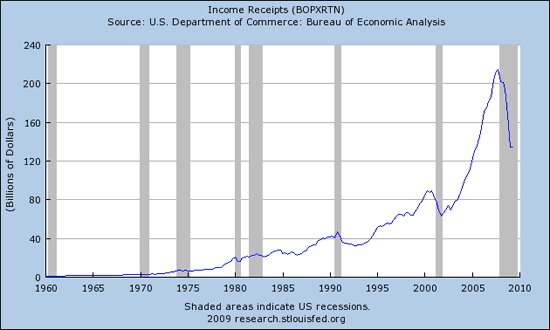
Federal Government receipts are down… big time. This is the nation’s INCOME from all sources:
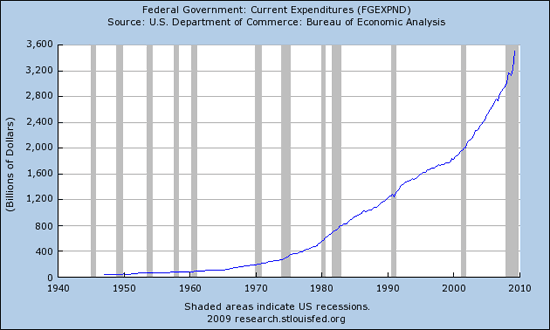
And yet to compensate what does our government do? Well, they believe that economic rules and math does not apply to them or the central banks, it only applies to us sheeple who eventually get taxed or robbed via the crashing value of our money. So, as our income is plummeting, our expenses are skyrocketing thanks to Economic Mass Psychosis:
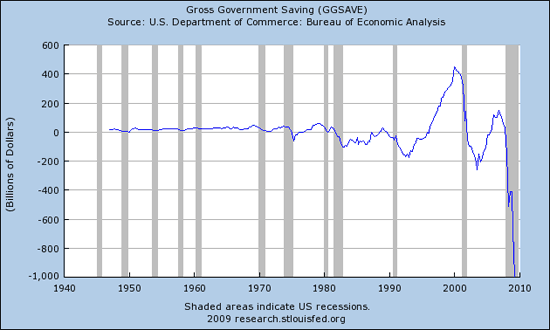
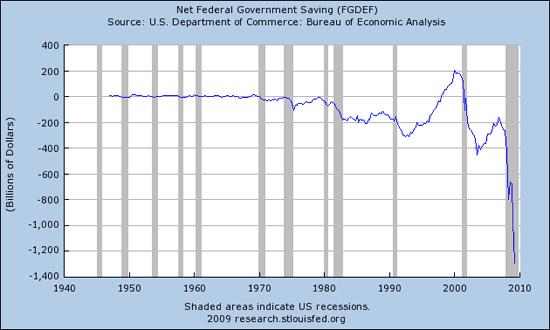
Of course with income down and expenses up, what does that do to our government’s savings? Oh yeah, that’s what happens…
INTERNATIONAL TRADE:
I like looking at import and export figures as a sign of economic activity as the numbers are not YET susceptible to massaging and manipulation unless you look at anything labeled “REAL.” Real means that it has been adjusted for inflation… what kind of inflation? The trumped up government kind, and those numbers are thus not reliable to reflect reality.
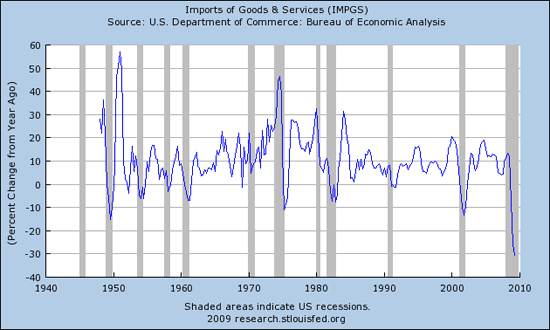
Let’s start with imports… are they looking any better? How about a 30% crash in yoy percent change? Greenshoots, really?
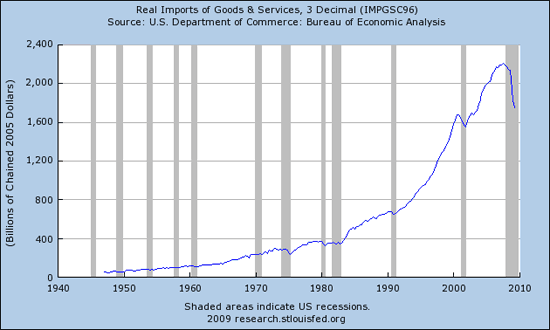
And just to throw in the “real” dollar figure for exports (in “chained” dollars, of course), you will see yet another parabolic curve and subsequent collapse as math and nature dictate that all exponential math collapses in the real world:
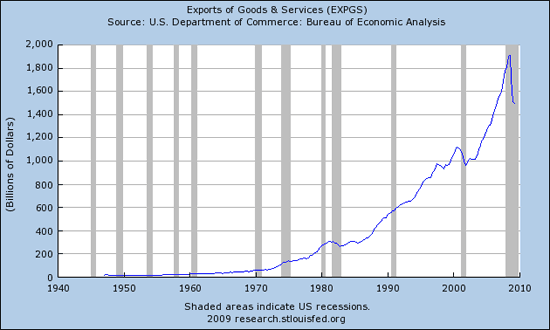
And Exports? Below is a chart of exports in raw billions of dollars. Note the classic parabolic shaped curve and subsequent collapse. Is it over?
Here is the same chart expressed in yoy % change. Down more than 20% with still no recovery whatsoever:
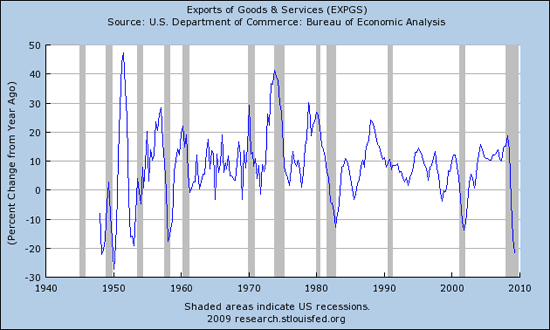
Still, note that exports have not fallen as much as imports. That means that our country’s demand is falling more than demand in the rest of the world. It also means that our negative balance of trade is coming in somewhat.
HOUSING:
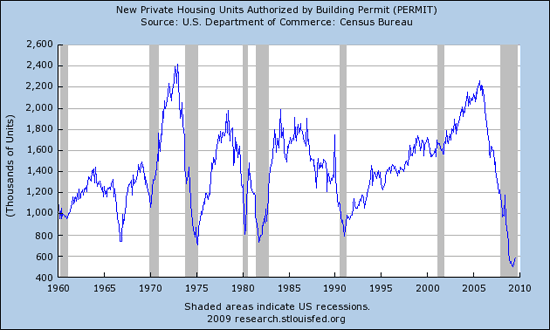
Oversupplied and overpriced, the housing correction continues but is migrating now to the more expensive homes financed primarily with option ARM loans. Those resets are in the pipeline and we are beginning to see them pick up already. Meanwhile, before a house can be built it must receive a permit. Permits have fallen to levels not seen in modern history and that’s a good thing as adding inventory to an oversupplied situation is not appropriate:
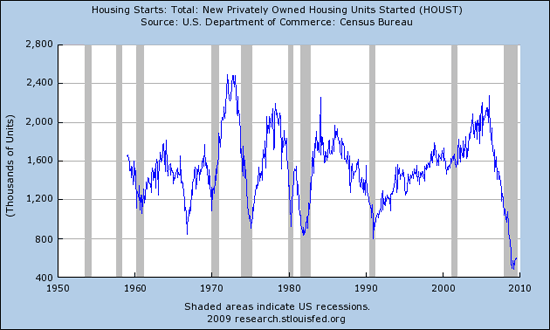
Housing starts are likewise still at historic lows:
The real question to ask in regards to housing is, “Do incomes support current rents?” This ratio is still out of whack, but is getting close in some areas. The problem I have with all of it is that I include the caveat, WITH NORMAL and CONVENTIONAL FINANCING. Can your income support a new house WITH NORMAL AND CONVENTIONAL FINANCING? Is financing normal when the Fed has interest rates artificially set at zero? What happens to affordability and thus prices when interest rates normalize?
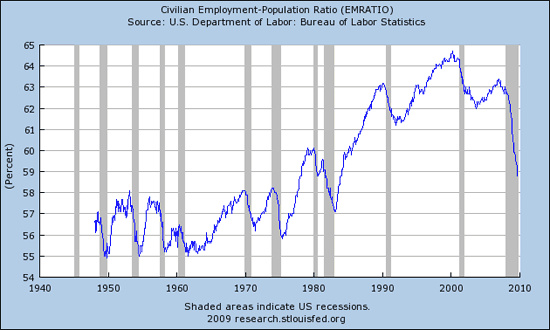
EMPLOYMENT:
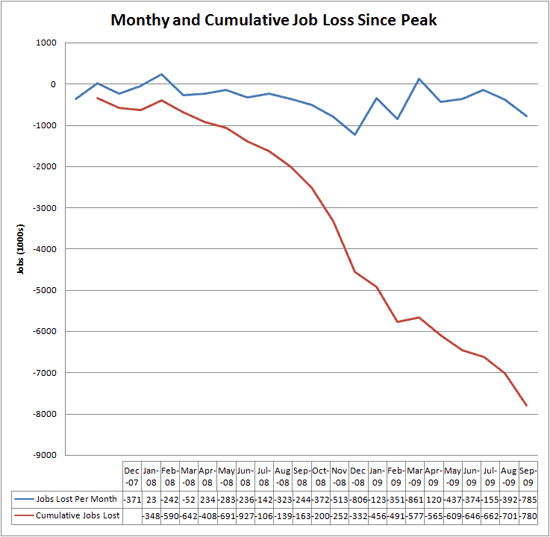
Joe made a terrific chart showing cumulative job losses since the end of ’07. The blue line represents jobs lost per month and the red line is cumulative. Nearly 8 million jobs lost in less than two years. This pulls massive amounts of personal income out of the economy and also pulls massive tax revenues out as well:
The civilian employment population ratio continues to erode and is on a slope pointing due south:
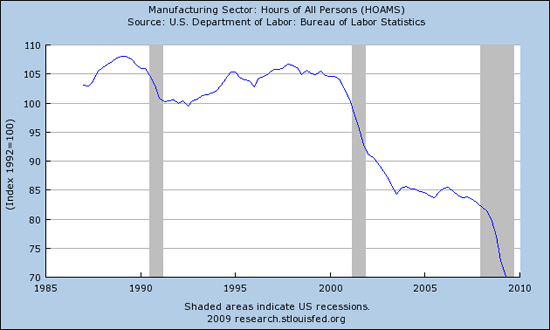
The number of hours worked in manufacturing continues to plummet:
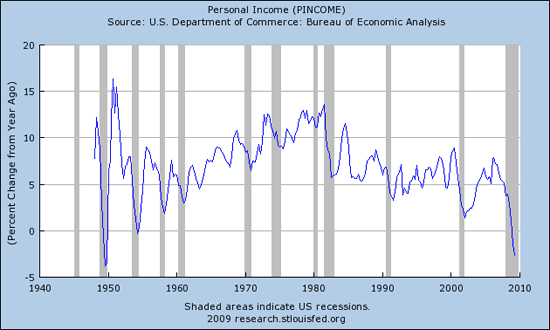
PERSONAL FINANCIAL HEALTH:
The consumer represents about 70% of the economy, so how are we looking? Personal income is decreasing at nearly a 3% rate:
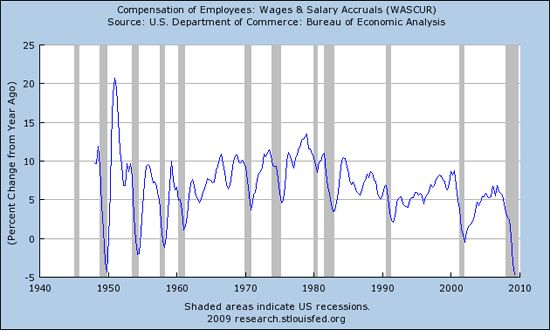
With unemployment rising and wages down overall, the total amount paid out in compensation is FALLING:
This is reflected in income receipts:
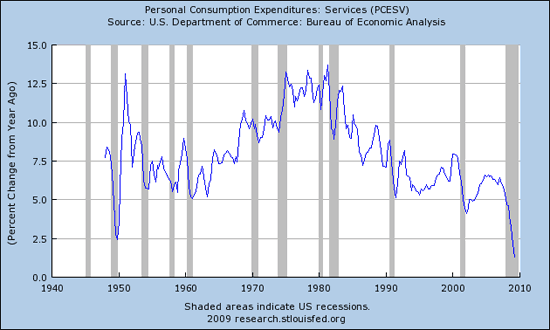
And it’s also reflected in personal consumption spending:
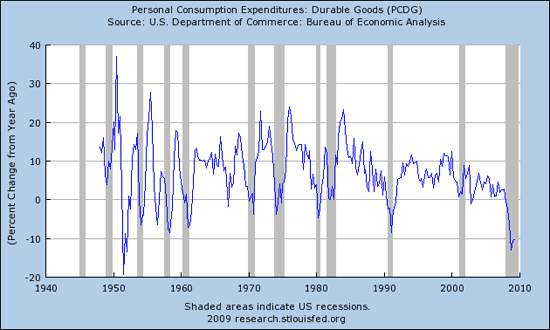
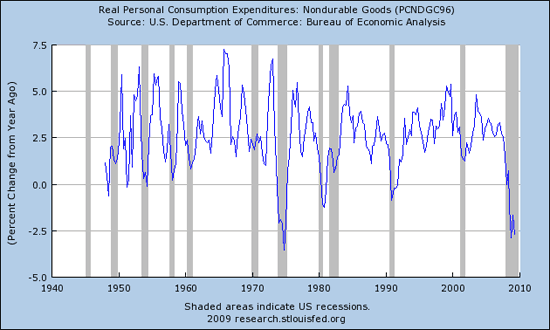
Consumption of both Durable and Nondurable Goods is falling:
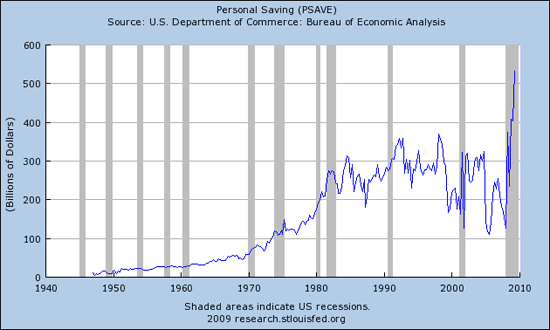
Ironically, despite falling overall incomes, personal savings are rising. This is somewhat misleading as consumers who pay off debt are counted as “saving.” We don’t know, for sure, how much is debt repayment and how much is actual savings.
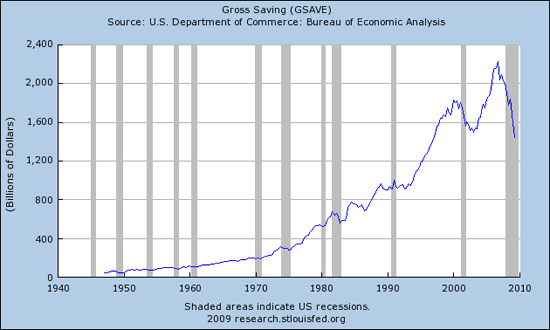
Here’s one clue, however, to the savings puzzle. While “savings” as reported above are climbing, unemployment is skyrocketing. How do unemployed people save? They don’t. And that’s why total GROSS savings are falling despite the increased savings rate. That might help to tell us that most, if not all, of the increased savings rate is actually debt repayment:
CORPORATE HEALTH:
With the stock market rising non-stop since March, surely investors are pricing in increased earning to justify the current 150+ price to earnings ratio, right? We’re about to find out, but earnings to be in historic norms will have to increase a mathematically impossible amount, so don’t look for that P/E ratio to return to historic ranges anytime soon UNLESS the PRICE corrects… hmmm.
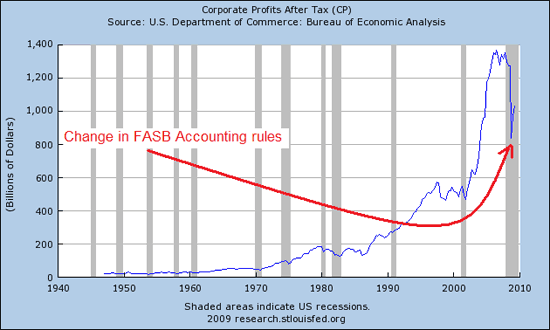
Corporate profits have enjoyed the boom times of money creation growing at an exponential rate, resulting in a parabolic mark-derivatives-to-fantasy blow off top and subsequent collapse. Then, to kick off this rally, FASB changed the much more realistic mark-to-market rules back to mark-to-fantasy, and wallah, the financials are back to “profits.” Those profits are not real and they will NEVER be recognized in reality. Meantime, people like Bank of America’s CEO, Ken Lewis, walks off with more than $40 million in personal ill-gotten gains at the expense of Americans who rightly own the central banking function from which he manipulated and stole.
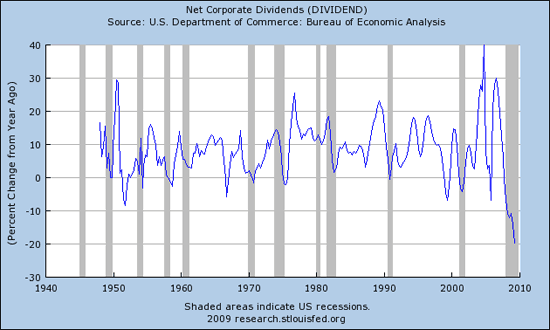
One reason to own stocks is to share in the profits of the company. Those profits are paid out in the form of dividends. Dividends, however, have plunged to follow alongside of plunging profits and are down 20% year over year!
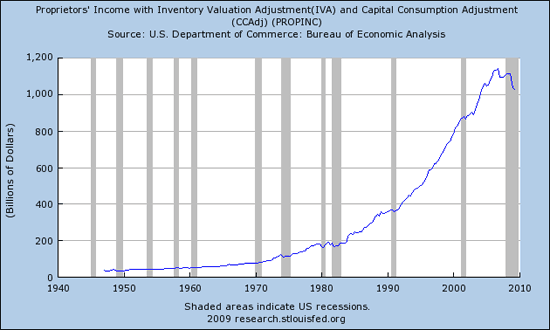
Corporate profits are down, and so too is proprietor’s income:
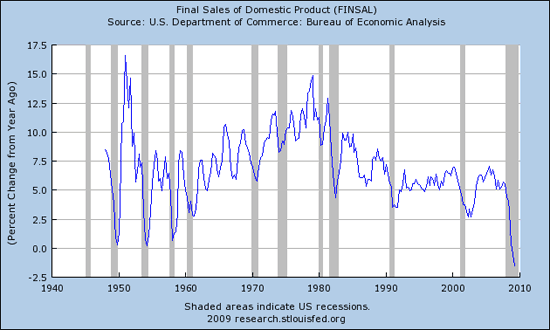
Sales are down as indicated by final sales of domestic products:
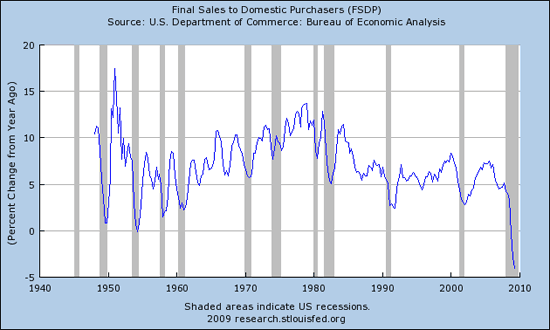
And sales to DOMESTIC purchases is down even more, once again showing that demand from within the U.S. is down more than demand in the rest of the world:
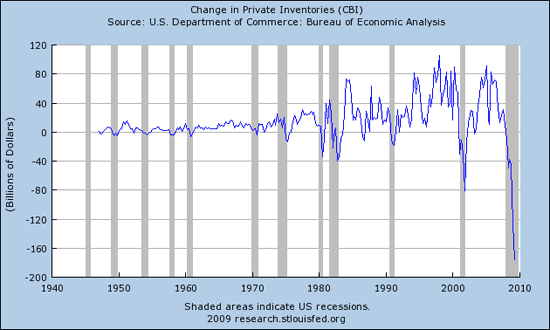
Of course inventories have been plummeting to correct for weak sales. Many believe that inventories were adjusted too far downwards and that rebuilding those inventories will lead to an increase in manufacturing. And, in fact, the manufacturing ISM just recently turned positive for the first time since this crisis began. Does that mean that it’s going to stay positive? We’ll have to watch inventories in conjunction with manufacturing and imports/exports, no sign yet of an inventory recovery:
Those are all recently revised charts that caught my attention, there are literally thousands at the St. Louis Fed’s website. It’s very difficult to put together an argument that the ECONOMY is recovering from my perspective. It’s also difficult to put together an inflation argument except for the money aggregates. Money aggregates do not capture what is happening to the shadow banking world of derivatives and leverage. It’s still my contention that deflation is occurring now despite the best efforts of governments to continue never-ending fantasy growth via inflation. The only thing they will be successful at in their efforts is to devalue the dollar and to destroy confidence in our entire monetary system and system of governance that has truly become a system of the corporation for the corporation.
The stock market IS NOT an indicator of anything other than the big players manipulations in the current condition. Those who claim economic recovery are looking at the markets and not at the real economy. The real economy will eventually catch up to the purveyors of paper engineering, and when it does…
Charts: St. Louis Fed
Disclaimer: This page contains affiliate links. If you choose to make a purchase after clicking a link, we may receive a commission at no additional cost to you. Thank you for your support!


Leave a Reply