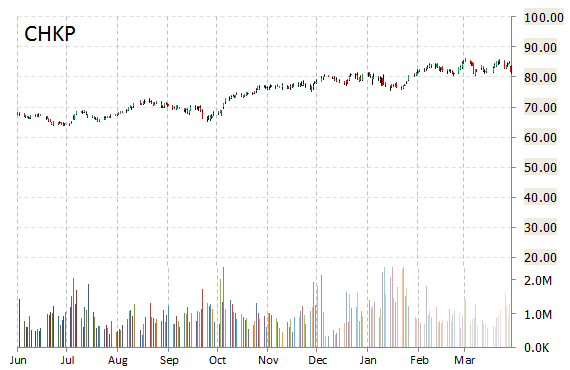
Check Point Software Technologies Ltd. (CHKP) reported this morning its first quarter 2015 earnings results.
The data security company recorded earnings of $0.95 per share on revenues of $373 million, up 9.0% from a year ago. Analysts were expecting EPS of $0.91 on revenues of $369.99 million. Net income for the period came in at $160.9 million, or 86 cents per share, from $153.08 million, or 78 cents per share, a year earlier.
“We are very pleased with the results of the first quarter. We continued to see success in all major geographies and delivered 11 percent growth in combined product and software blade revenues,” said in a statement Gil Shwed, founder, chairman, and CEO of Check Point Software Technologies.
On valuation measures, Check Point Software Technologies Ltd. shares, which currently have an average 3-month trading volume of 994K shares, trade at a trailing-12 P/E of 23.83, a forward P/E of 18.41 and a P/E to growth ratio of 2.13. The median Wall Street price target on the name is $86.00 with a high target of $94.00. Currently ticker boasts 16 ‘Buy’ endorsements, compared to 14 ’Holds’ and no ‘Sell’.
Profitability-wise, CHKP has a t-12 profit and operating margin of 44.09% and 53.55%, respectively. The $15.11 billion market cap company reported $254.78 million in cash in its most recent quarter.
CHKP currently prints a one year return of 23.17% and a year-to-date return of 4%.
The chart below shows where the equity has traded over the last 52 weeks.
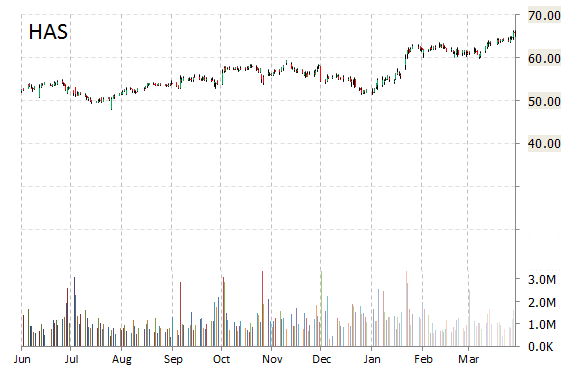
Hasbro Inc. (HAS) reported first quarter EPS of $0.21 before the opening bell Monday, compared to the consensus estimate of $0.08. Revenues increased 5.0% from last year to $713.5 million. Analysts expected revenues of $660.27 million. Net earnings for the period came in at $26.7 million or $0.21 per share, compared to $32.1 million, or $0.24 per share, in 2014. The company said net income increased 43% excluding $13.5 million, or $0.10 per diluted share, of favorable tax adjustments in Q1/14.
“2015 is off to a good start with continued momentum in our business, led by growth in all of our Franchise Brands and the underlying strength in demand across international markets, including the emerging markets,” stated Brian Goldner, Hasbro’s President and CEO. “For the first quarter, we grew revenue, improved profitability and delivered growth in adjusted net earnings despite significant foreign exchange headwinds. While the first quarter is the least significant quarter of the year, the global Hasbro team delivered a strong start to the year.”
The $8.19 billion market cap company reported $1.08 billion in cash in its most recent quarter.
Hasbro shares recently gained $5.11, or 7.76%, to $71. In the past 52 weeks, shares of Pawtucket, Rhode Island-based toy maker have traded between a low of $48.01 and a high of $66.32. Shares are up 26.27% year-over-year and 20.75% year-to-date.
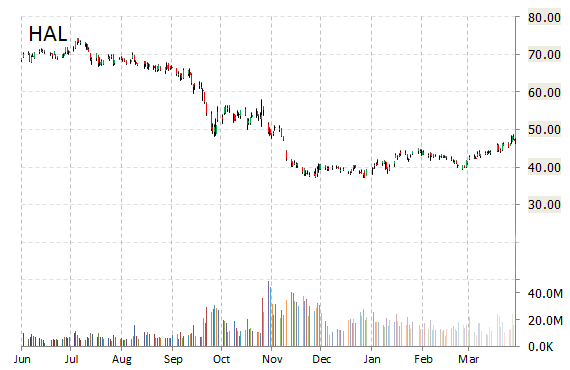
Shares of Halliburton Company (HAL) gained $0.29 to $47.18 after the company released its earnings results on Monday. The provider of drilling services to oil and gas operators reported Q1’15 EPS of $0.49 per share vs. $0.38 consensus on $7.05 billion in revenue, down 4.1% from a year ago. For the period, the company reported a net income loss of $643 million, vs. a profit of $622 million in the same period a year earlier.
“Total company revenue of $7.1 billion for the first quarter was down 4% year-over-year, significantly outpacing a 19% global rig count decline, and represented industry-leading performance amidst a challenging commodity price environment. Our global customer base has responded by lowering activity levels and seeking price concessions, which has impacted our margins. As evident by the restructuring charges taken during the quarter, we are taking steps to help mitigate the ongoing impact,” said in a statement Dave Lesar, chairman and CEO, Halliburton.
HAL shares are down 21.46% year-over-year and have gained roughly 20% year-to-date. In the past 52 weeks, shares of Houston, Texas-based company have traded between a low of $37.21 and a high of $74.33.
Halliburton closed Friday at $46.89.The name has a total market cap of $39.84 billion.
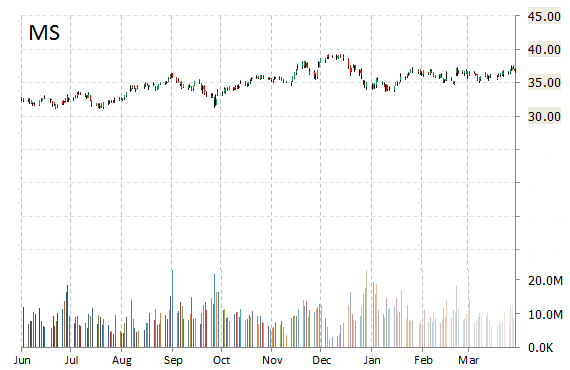
Morgan Stanley (MS) gained $0.75, or 2.04%, to $37.50 in pre-market trading after it reported fiscal results for the first quarter.
In its quarterly report, the banking giant said it earned $0.85 per share excluding items, well above the $0.79 per share analysts were expecting. Revenue rose 10.1% to $9.91 billion, above views for $9.19 billion. For the current quarter, net income applicable to common shareholders was $2.4 billion or $1.18 per share, a 60% increase compared with net income of $1.5 billion or $0.74/shr in Q1/14.
On valuation measures, Morgan Stanley shares are currently priced at 22.93x this year’s forecasted earnings compared to the industry’s 20.11x earnings multiple. Ticker has a PEG and forward P/E ratio of 0.82 and 11.17, respectively. Price/Sales for the same period is 2.15 while EPS is $1.60. Currently there are 11 analysts that rate MS a ‘Buy’, 18 rate it a ‘Hold’. No analyst rates it a ‘Sell’. MS has a median Wall Street price target of $38.50 with a high target of $46.00.
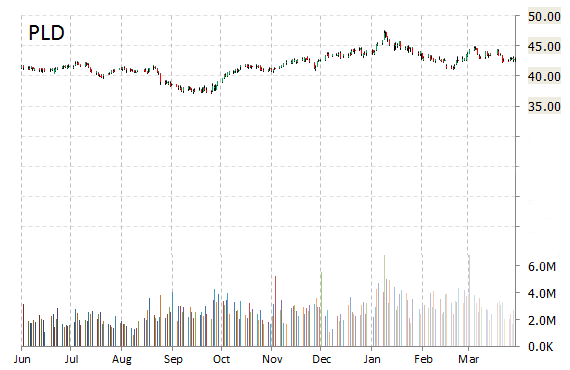
Shares of Prologis, Inc. (PLD) edged 22 cents higher to $43.10 after the company reported first-quarter earnings of $462.9 million, or $0.49 per share. Analysts had been modeling $420.81 million and $0.50 per share.
For full-year 2015, PLD provided EPS guidance of $2.07 – $2.13 versus consensus of $2.08 per share.
On valuation measures, Prologis Inc. shares, which currently have an average 3-month trading volume of 3.21 million shares, trade at a trailing-12 P/E of 34.52. The median Wall Street price target on the name is $49.00 with a high target of $56.00. Currently ticker boasts 14 ‘Buy’ endorsements, compared to 8 ’Holds’ and no ‘Sell’.
Profitability-wise, PLD has a t-12 profit and operating margin of 33.57% and 23.96%, respectively. The $21.96 billion market cap company currently prints a one year return of 8.33% and a year-to-date return of less than one percent.
The chart below shows where the equity has traded over the last 52 weeks.
Disclaimer: This page contains affiliate links. If you choose to make a purchase after clicking a link, we may receive a commission at no additional cost to you. Thank you for your support!

Leave a Reply