Here is a graphical look at how different investments, from Dow shares to crude oil, fared last week:
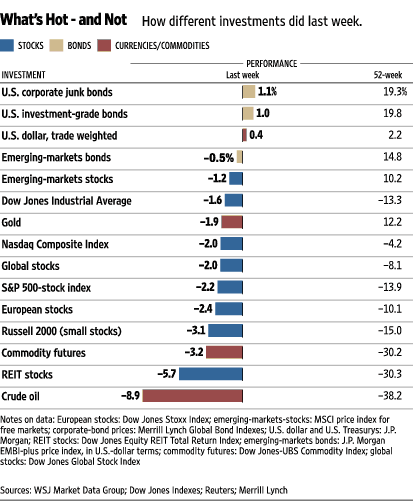
As the chart above illustrates, Crude oil, the most actively traded commodity futures contract, dominated during the week the asset class chart by posting negative gains of 8.9%, followed by REIT’s, Commodity futures, and R2K, 5.7%, 3.2%, 3.1%, respectively. Excluding gains from junk bonds ; 1.1%, investment grade bonds ; 1.0%, and greenback’s 0.4 percentage points, all global investments posted negative returns.
On a y/y basis Crude oil, REIT’s, Commodity futures, R2K, Euro stocks, S&P 500, Global stocks, Naz, and Dow are is still in negative territory : (-38.2%); (-30.3%); (-30.2%); (-15.02%); (-10.1%); (-13.9%); (-8.1%); (-4.2%); (-13.3%), respectively.
Graph: WSJ
Disclaimer: This page contains affiliate links. If you choose to make a purchase after clicking a link, we may receive a commission at no additional cost to you. Thank you for your support!
Leave a Reply