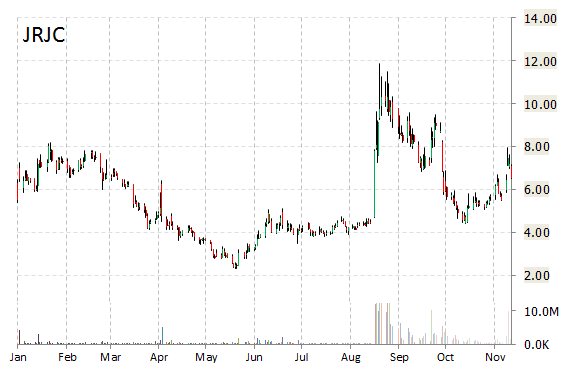
Shares of China Finance Online (JRJC) surged over 12% to $7.41 in mid-day trading Friday. Approximately 1.9M shares have already changed hands, compared to the stock’s average daily volume of 4.31M. Not seeing any news to account for the move.
During today’s trading session, JRJC gapped open sharply higher and climbed for the majority of the morning, before settling into a range of $7.10 to $7.24 with its 52-week range being $2.33 to $11.88. On an intraday basis the name has gotten as low as $6.45 and as high as $7.48.
Fundamentally, JRJC shows the following financial data:
· $20.39 million in cash
· $133.4 million total current assets
· $83.42 million t-12 total revenue
· ($8.10) million quarterly net income
On valuation measures, China Finance Online shares have a t-12 price/sales ratio of 1.72 and a price/book for the same period of 2.41. EPS is ($0.40). JRJC has a market cap of $160.01M and a median Wall Street price target of $8.30.
Shares of China-based integrated financial information and services provider are up 173% year-over-year, and 15% year-to-date.
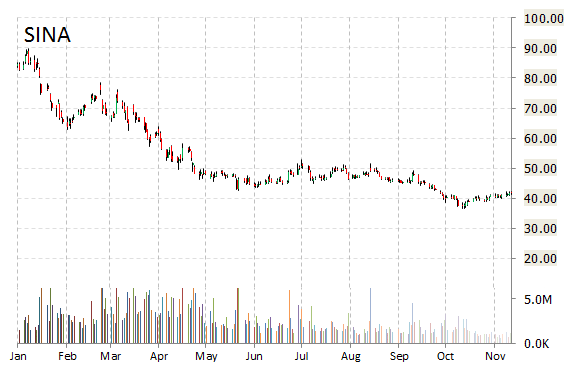
Shares of Sina Corp. (SINA) are down 6% to $39.36 after the Shanghai-based online media company guided Q4 revs below consensus. Sina said 4Q revenues are projected to be between $204 million and $210 million vs consensus estimate of $214.75 million. For the third quarter, Sina reported non-GAAP EPS of $0.19 per share, 2 cents better the consensus estimate of $0.17 per share. Revenue came in at $198.61 million, up from $184.63 million a year ago. Analysts were looking for revs of $196.36 million.
In other Sina news, the name was downgraded this morning at Stifel to ‘Hold’ from ‘Buy’ and removed from its “Select List”. Stifel cited a lack of positive catalysts as the reason for the downgrade. Sina had also its price target lowered to $65 from $75 at Pacific Crest, and to $60 from $70 at Piper Jaffray.
On valuation measures, Sina is currently priced at 51.61x this year’s forecasted earnings, which makes it relatively expensive compared to the industry’s 17.92x earnings multiple. The company’s current year and next year EPS growth estimates stand at -24.80% and 61.20% compared to the industry growth rates of -0.10% and 15.80%, respectively. SINA has a t-12 price/sales ratio of 3.72. EPS for the same period registers at $0.77.
Sina’s shares have advanced 9.01% in the last 4 weeks and declined 14.82% in the past three months. Over the past 5 trading sessions the stock has gained 2.98%. Shares of Sina Corporation are down 50.33% this year, and 50.50% year-over-year.
The company, which is currently valued at $2.60B, has a median Wall Street price target of $66.00 with a high target of $80.00.
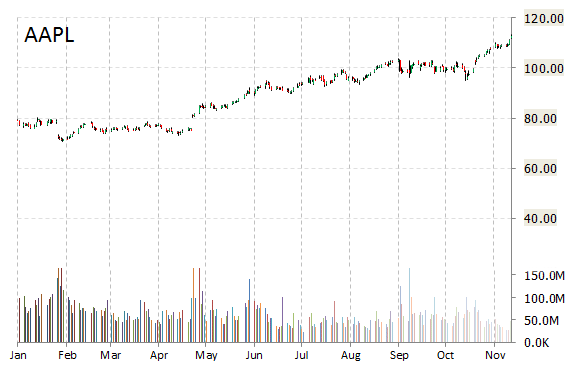
Shares of Cupertino, Calif.-based Apple Inc. (AAPL) advanced less than 1 percent to $113.74 in mid-day trading Friday despite news the European Commission has opened three in-depth investigations to examine whether decisions by tax authorities in Ireland, The Netherlands and Luxembourg with regard to the corporate income tax to be paid by Apple, Starbucks and Fiat Finance and Trade, respectively, comply with the EU rules on state aid.
Commission Vice President in charge of competition policy Joaquín Almunia said: “In the current context of tight public budgets, it is particularly important that large multinationals pay their fair share of taxes. Under the EU’s state aid rules, national authorities cannot take measures allowing certain companies to pay less tax than they should if the tax rules of the Member State were applied in a fair and non-discriminatory way.”
Apple Inc, currently valued at $667.44B, has a median Wall Street price target of $116.00 with a high target of $143.00. Approximately 30.23M shares have already changed hands, compared to the stock’s average daily volume of 58.65M.
In the past 12 months, shares of the iPhone maker have traded between a low of $70.51 and a high of $114.08 with the 50-day MA and 200-day MA located at $103.49 and $96.47 levels, respectively. Additionally, shares of AAPL trade at a P/E ratio of 1.30 and have a Relative Strength Index (RSI) and MACD indicator of 78.30 and +3.35, respectively.
AAPL currently prints a one year return of about 54.89%, and a year-to-date return of around 43.74%.
Leave a Reply