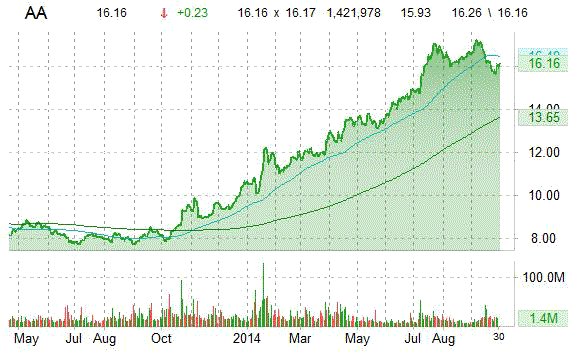
Alcoa Inc. (AA) was upgraded by Bank of America (BAC) from a ‘Neutral’ rating to a ‘Buy’ rating in a research note issued on Tuesday.
AA shares recently gained $0.23 to $16.16. In the past 52 weeks, shares of New York-based aluminum producer have traded between a low of $7.82 and a high of $17.36. Shares are up 95.70% year-over-year and 50.57% year-to-date.
The chart below shows where the equity has traded over the last year, with the 50-day and 200-day moving averages included.
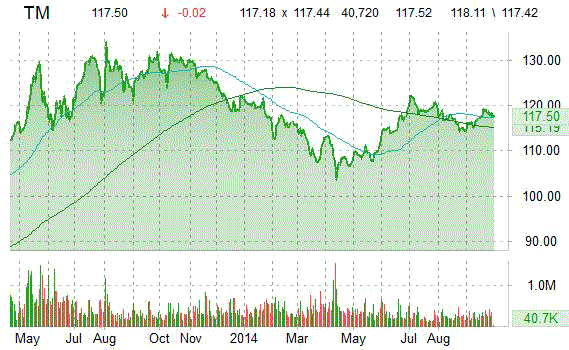
JP Morgan (JPM) is out with a report this morning upgrading shares of Toyota Motor Corporation (TM) with an ‘Overweight ’ from ‘Neutral’ rating.
TM shares recently gained $0.87 to $118.39. The stock is down more than 9.78% year-over-year and has lost roughly 3.61% year-to-date. In the past 52 weeks, shares of Toyota City, Japan-based auto maker have traded between a low of $103.38 and a high of $132.53.
Toyota Motor Corporation, which closed Monday at $117.52, has a total market cap of $186.26B.
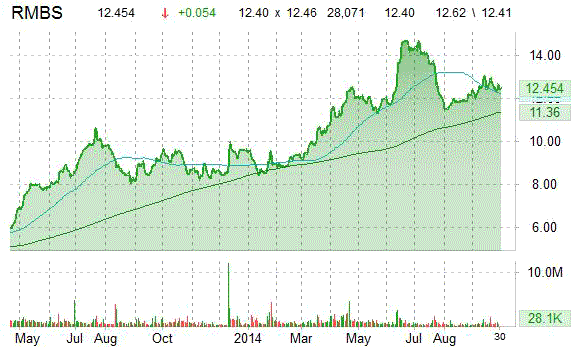
Rambus Inc. (RMBS) had its price target raised to $14 from $13.50 by analysts at Jefferies on Tuesday, who said adoption of Rambus’ Crypto Manager hardware based security solution will accelerate in mobile payment platforms. The firm keeps a ‘Hold’ rating on RMBS.
Rambus Inc. shares currently have a PEG, price-to-book, and forward P/E ratio of 1.84, 3.87, and 34.44, respectively. Price/sales for the same period is 4.70 while EPS is ($0.03). Currently there is one analyst that rates RMBS a ‘Strong Buy’, 3 rate it a ‘Buy’ and 2 rate it a ‘Hold’. No analysts rate it a ‘Sell’. RMBS has a median Wall Street price target of $15.75 with a high target of $17.00.
In the past 52 weeks, shares of Sunnyvale, California-based company have traded between a low of $8.15 and a high of $14.82 and are now at $12.64. Shares are up 35.22% year-over-year and 30.94% year-to-date.
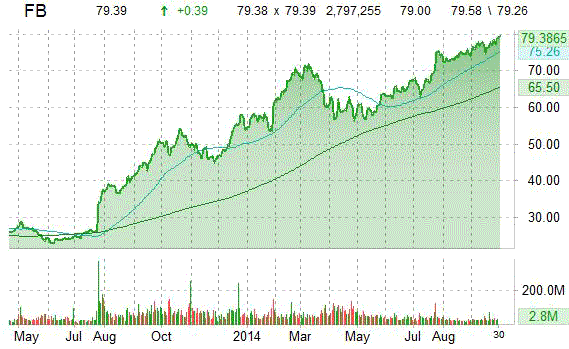
Facebook, Inc. (FB) was reiterated with an ‘Outperform’ by RW Baird analysts on Tuesday. The broker also kept a $82 per share price target on the stock, citing Atlas as an evolution in FB’s ad platform that should help improve monetization.
Facebook gained $0.26 to $79.26 in morning trading today. Approximately 1,625,690 shares have already changed hands, compared to the stock’s average daily volume of 36,427,800 shares.
On valuation-measures, shares of Facebook have a trailing-12 and forward P/E of 84.23 and 38.92, respectively. P/E to growth ratio is 1.29, while t-12 profit margin is 23.78%. EPS registers at $0.94. The company has a market cap of $206.08B and a median Wall Street price target of $88.50 with a high target of $100.00.
On trading-measure, FB has a beta of 0.94 and a short float of 1.93%. In the past 52 weeks, shares of the social networking company have traded between a low of $43.55 and a high of $79.50 with the 50-day MA and 200-day MA located at $76.00 and $67.17 levels, respectively.
FB currently prints a one year return of about 54.18% and a year-to-date return of around 44.56%.
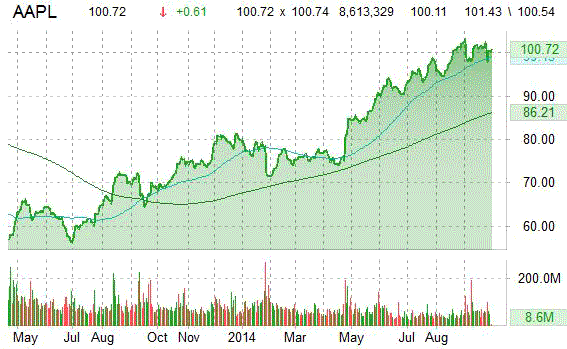
Analysts at Jefferies initiated coverage on Apple Inc. (AAPL) with an ‘Hold’ rating and a $110 price target in a research report issued to clients on Tuesday. The firm’s price objective suggests a potential upside of 9.87% from the stock’s previous close.
In other Apple news, the company today announced that iPhone 6 and iPhone 6 Plus will be available in China beginning Friday, October 17. Separately, Apple is expected to receive 9.7- and 12.9-inch iPad panels from Samsung Display in 2H14, Digitimes reports.
On trading-measures, Apple, which is currently valued at $606.51B, has a median Wall Street price target of $110.00 with a high target of $139.00. Approximately 3,853,964 shares have already changed hands, compared to the stock’s average daily volume of 54,575,400.
In the past 52 weeks, shares of the iPhone maker have traded between a low of $68.33 and a high of $103.74 with the 50-day MA and 200-day MA located at $100.20 and $90.29 levels, respectively. Additionally, shares of AAPL trade at a P/E ratio of 1.30 and have a Relative Strength Index (RSI) and MACD indicator of 50.01 and -1.50, respectively.
AAPL currently prints a one year return of about 47.70% and a year-to-date return of around 26.35%.
Leave a Reply