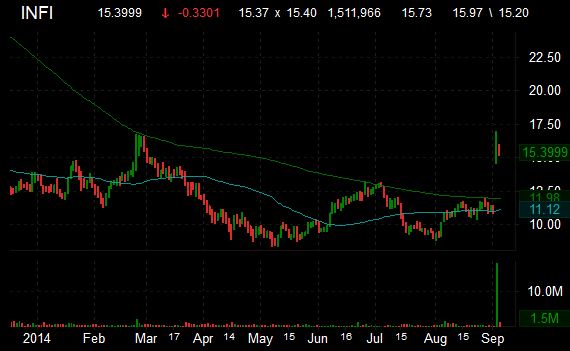
Analysts at JMP Securities upgraded Infinity Pharmaceutical (INFI) from a ‘Market Perform’ rating to a ‘Market Outperform’ rating in a research note issued to investors on Thursday. Infinity shares recently declined 1.2% to $15.61. The stock is down more than 22% this year and has gained roughly 15% over the past 9 months. In the past 52 weeks, shares of the Cambridge, Massachusetts-based drug developer have traded between a low of $8.40 and a high of $21.60.
The stock is trading on heavy volume with more than 1.3 million shares changing hands, well ahead of its three month daily average of 784,378 shares. Infinity Pharmaceuticals has a total market capitalization of $759 million.
The chart below shows where the equity has traded over the last year, with the 50-day and 200-day moving averages included.
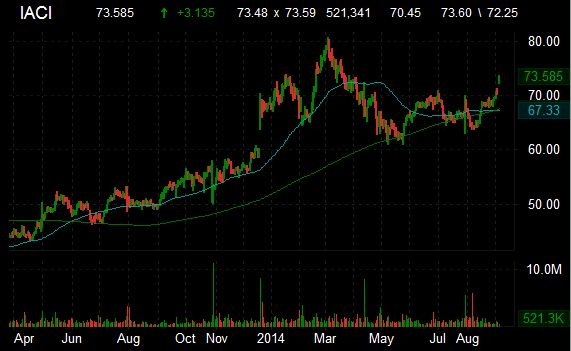
Analysts at Barclays upgraded IAC/InterActiveCorp (IACI) from an ‘Equal Weight’ rating to an ‘Overweight’ rating in a research note issued to clients on Thursday. IACI shares recently surged 4% to $73.31. The stock is down more than 44% year-over-year and has gained roughly 7% year-to-date. In the past 52 weeks, shares of the New York-based media and Internet company have traded between a low of $49.84 and a high of $80.64.
The stock is trading on relatively strong volume with more than half a million shares already changing hands in the first hour of Nasdaq’s regular trading, as compared to ticker’s three month daily average of 1.187M shares. IAC/InterActiveCorp has a total market capitalization of $6.15 billion.
The chart below shows where the equity has traded over the last year, with the 50-day and 200-day moving averages included.
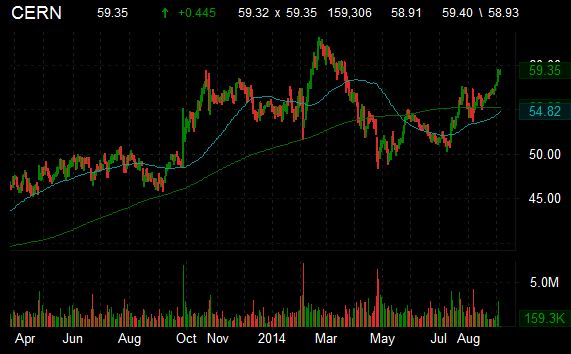
JP Morgan (JPM) analysts resumed shares of Cerner Corporation (CERN) with an ‘Overweight’ rating in a research note issued to investors on Thursday. Cerner shares recently gained 62 cents to $59.52. The stock is up more than 25% year-over-year and has gained roughly 6.50% over the last 9 months. In the past 52 weeks, shares of the North Kansas City, Missouri-based healthcare information technology provider have traded between a low of $45.81 and a high of $63.07.
The stock is trading on a normal volume with more than 208K shares changing hands, compared to its three month daily average of 1.77 million shares. Cerner Corporation has a total market capitalization of $20.26 billion.
The chart below shows where the equity has traded over the last year, with the 50-day and 200-day moving averages included.
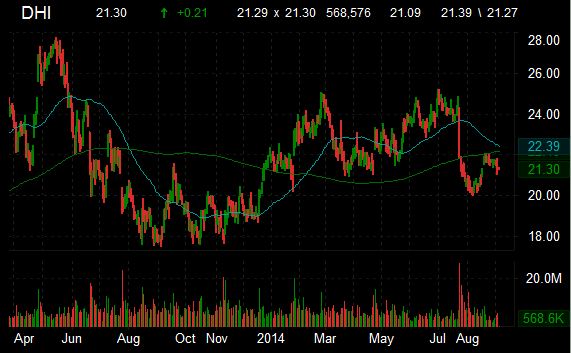
UBS analysts upgraded shares of DR Horton (DHI) with a ‘Buy’ rating from a ‘Neutral’ rating in a research report issued to investors on Thursday. DR shares recently gained 17 cents to $21.26. The stock is up more than 21% on a year-over-year basis. Year-to-date ticker registers a negative return of about 4.75%. In the past 52 weeks, shares of the Fort Worth, Texas-based homebuilding company have traded between a low of $17.52 and a high of $25.23.
The stock is trading on a normal volume with more than 839K shares changing hands, compared to its three month daily average of 5.68 million shares. DR Horton, Inc. has a total market capitalization of $7.76 billion.
The chart below shows where the equity has traded over the last year, with the 50-day and 200-day moving averages included.
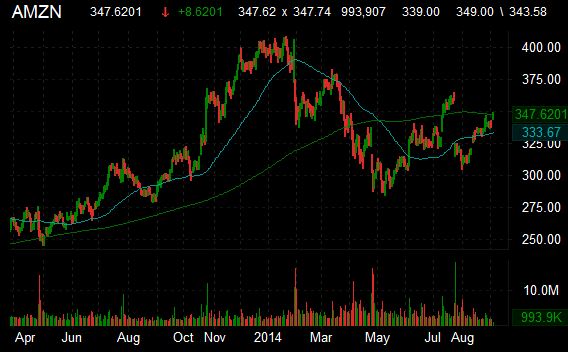
Analysts at Bernstein raised their price target on shares of Amazon.com (AMZN) to $450 from $360 in a research report issued to clients on Thursday. Amazon shares, which closed at $339 yesterday, are up nearly 10 points off the open following the firm’s positive comments. Bernstein ’s new target price suggests a potential upside of about 29.31% from the company’s current price of $348.
Amazon shares are up more than 18.50% year-over-year. The stock however has lost roughly 13% of its value over the last 9 months. In the past 52 weeks, shares of the Seattle, Washington-based online retailer have traded between a low of $284.38 and a high of $408.06.
AMZN is trading on a normal volume with more than 1.2M shares changing hands, compared to its three month daily average of 3.7 million shares. Amazon.com has a total market capitalization of $160.85 billion.
The chart below shows where the equity has traded over the last year, with the 50-day and 200-day moving averages included.
Leave a Reply