Every year, the Congressional Budget Office (CBO) adds to its short-term budget forecasts (10 years and 25 years) a long-term (75-year) outlook. The 2013 Long-term Budget Outlook was published earlier this week.
The CBO, of course, admits that “the uncertainty of budget projections increases the farther the projections extend into the future.” Some would argue that such forecasting exercises are useless, but I think this is not true.
Like other agencies, the CBO is composed of bureaucrats who are seldom favorable to reducing their bureau’s importance, opportunities, and perks. They do not tend to be very critical of the state. Yet the CBO is a nonpartisan congressional agency well regarded for its economic expertise. It is partly immune to partisan pressure because its reputation and existence depend on its impartiality.
According to an alternative scenario, the CBO envisions the federal debt reaching 190% of GDP in 25 years.
It is true that any forecast must be taken with a grain of salt. The longer the horizon, the bigger the grain of salt. Economists cannot forecast one year into the future, so how can they roll their crystal ball nearly a century ahead? Yet forecasts can serve to organize one’s thoughts and lay bare one’s assumptions. They can also reveal much about the thinking of the forecasters. The CBO’s budget forecasts are especially instructive in revealing the federal government’s fears.
In my book The Public Debt Problem, published earlier this year, I relied on the CBO’s 2011 and 2012 forecasts. As expected, the newly published 2013 long-term forecast contains no big surprises. It clearly shows again that the federal budget is unsustainable.
Like the CBO, I often show debt and budget figures as a proportion of GDP. But isn’t GDP meaningless? Contrary to many of my friends, I don’t think so. GDP is certainly an imperfect measure of production and can certainly be misused. But it can be useful if one correctly understands what it actually measures. In the present case, just as a consumer must compare his debt with his income, it seems natural to compare government debt with the country’s GDP.
There is a problem with this comparison, but it runs much deeper than discussions about the nature of GDP. What the people produce and earn (that is, GDP) is not equivalent to the revenues of their government, even if the latter come from the former. But this is what contemporary governments think — that they can use everything that people produce and earn as collateral for their debt. The Government Accountability Office (GAO) admits it in barely different words. Talking about the published balance sheet of the federal government, the GAO notes that it “does not include the financial value of the government’s sovereign power to tax, regulate commerce, and set monetary policy,” while in fact, the government does have access to “the country’s wide economic base.”
We don’t have to swallow this in order to use the standard way of comparing government debt over time by considering it as a proportion of GDP. So let’s get back to our topic.
The recent budget shenanigans reduced future federal spending and taxes (as a proportion of GDP) only slightly and without affecting their long-term path. This is shown eloquently by our two figures below, borrowed from the CBO, under the assumption that current spending and taxing laws remain in force.
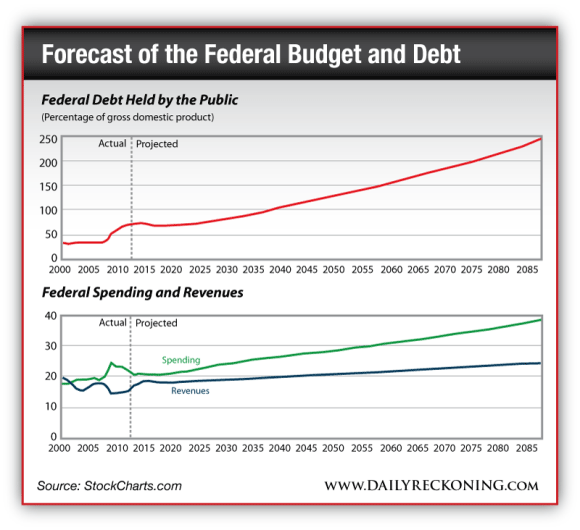
The bottom figure shows federal spending and revenues as a proportion of GDP. The top figure gives the federal debt held by the public (one measure of the federal public debt), also as a proportion of GDP. From 2000-2013, the curves show actual data; from 2014-88, they represent the CBO’s forecasts.
The annual federal deficit is represented by the distance between the spending and the revenue curves on the bottom chart. Recall that revenues, spending, and deficits are flows calculated over a period of time, as opposed to stocks like the debt. Flows during a certain period of time accumulate into stocks, which are calculated at a given point in time. Imagine the deficit as the flow coming from the faucet; the debt is the plugged sink into which the water flows. Our top figure shows the stock of debt at the end of each fiscal year; the bottom figure gives revenues and spending flows calculated for each fiscal year.
The sequester and recent tax breaks did not actually amount to much. The cumulative deficits over the next 10 years will not disappear. The CBO forecasts that by 2023, these deficits will have added $6.3 trillion to the federal debt. One year ago, a similar 10-year forecast showed a $10 billion accumulation of new debt. An improvement, but nothing worth a Nobel Prize.
Look at the bottom figure. Mainly because of increased spending, the federal deficit (the distance between the two curves) will still be 3.3% of GDP in 2023 compared with 3.8% in 2013. (The deficit in proportion of GDP can decrease while spending increases because GDP is forecasted to grow.) The result is that the federal debt will have dropped to 71% of GDP compared with 73% now, as shown on the top figure.
That’s the good news. Over the longer term, revenues creep up slightly while expenditures and the deficit continue to roar. By 2038, federal spending will have reached 26% of GDP compared with an average of 20.5% over the last 40 years (leading to 2013). The increase in federal spending will be driven mainly by Social Security and health programs. By 2038, federal revenues will have reached 20% of GDP compared with 17.5% on average during the last 40 years. The federal deficit will stand at over 6% of GDP. The federal debt held by the public will have reached 100% of GDP.
Except if major cuts in federal expenditures are made, we should expect a debt crisis and a federal default.
The projections to 2088 are even more interesting. The same trends will have continued, with spending now driven mainly by health care and interest expenditures. The CBO forecasts that spending will reach 39% of GDP (note that this does not include state and local government expenditures), and that bracket creep will boost revenues to 25% of GDP. The federal deficit will run at 14% of GDP — much more than during the dark year of 2009. And the federal debt will stand at 245% of GDP.
Things could turn out even worse. Future obligations of the federal government are underestimated. The CBO unconvincingly suggests that things might also turn out better.
The above projections, the CBO admits, do not incorporate “the harm that growing debt would cause to the economy.” Interest on the debt will rise, pushed by two factors: Interest rates are expected to return to more normal level, and — this is the main factor — higher levels of debt mean higher interest payments. The CBO expects interest spending by the feds to jump from 1.3% of GDP now to 3.1% in 10 years’ time, 4.9% in 25 years, and a crushing 12% in 2088.
According to an alternative scenario, the CBO envisions the federal debt reaching 190% of GDP in 25 years.
The growing level of the federal debt and the further pressure it will exert on interest rates will crowd out private investment, reduce economic growth, and worsen the outlook. A vicious circle of increasing debt and reduced growth will start rolling. “At some point,” the CBO admits, “investors would begin to doubt the government’s willingness or ability to pay U.S. debt obligations.” A fiscal crisis would ensue.
And all this still does not factor in the possibility of a recession, or a major war, or a massive natural catastrophe (earthquake, pandemic…), or a nuclear contamination. With their current and future levels of debt, the feds have little leeway.
Unsurprisingly, the CBO concludes that “under a wide range of possible assumptions about some key factors that influence federal spending and revenues, the budget is on an unsustainable path.”
What’s in store for the future? Except if major cuts in federal expenditures are made, we should expect a debt crisis and a federal default. Then the main question is when the avalanche will start rolling.

Leave a Reply