If you’re following gold’s bumpy ride this year, two simple charts will tell you everything you need to know about the yellow metal’s prospects.
Gold futures are sinking this morning. The price has dropped about $18 off yesterday’s highs. That puts gold just below $1,395. For the past five trading sessions, gold has slowly trended lower. It’s consolidating just below $1,425. So if you’re a fan of the rally off its July lows, you should be encouraged by this action.
Right now, gold is approaching an important trading zone. If it successfully penetrates $1,425, all of the damage it has endured since mid-May will be repaired.
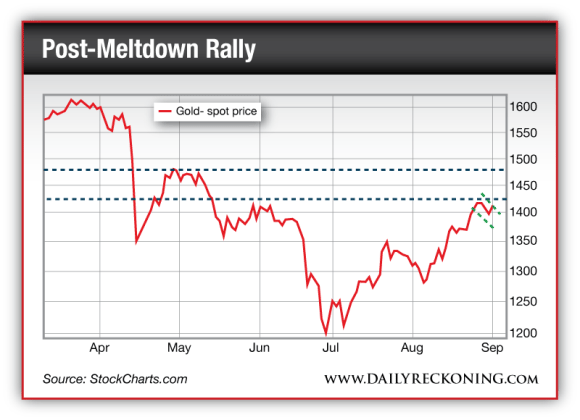
This zone between $1,425 – $1,475 won’t be easy to leave behind. Remember, this is same area that contained the meat of gold’s major drawdown back in April. If long-term bullish buyers really are in control, they will need to make their presence felt if gold has any chance at all at $1,475…
However, if you want to truly understand how important this trading zone has become for gold, you have to view gold’s entire bull market over the past decade…
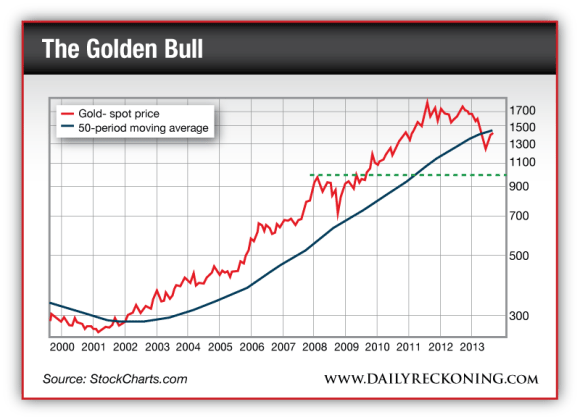
Gold lost the mammoth uptrend that guided it to gains since 2002. Now, gold is approaching a point where it could attempt to challenge its 50-period moving average. If it fails again near $1,450, I expect the metal to continue its downtrend, ultimately landing somewhere between $1,100-$1,000. That would allow a complete retracement of 2010-2011 push toward $2,000.
I’ve spent a lot of time talking about the stock market’s potential make-or-break moments lately. But gold is now getting to the point where a couple of trading weeks in either direction could ultimately decide its fate. If gold fails here, expect another leg lower toward my ultimate price target.

Leave a Reply