The Bureau of Economic Analysis reported Friday that U.S. real GDP grew at an anemic 1.5% annual rate during the second quarter. When the same bad thing keeps happening to you again and again, “disappointed” no longer seems the appropriate word to use.
Lower spending by state and local government and lower net exports each subtracted about 0.3% from the annual GDP growth rate. And there just wasn’t any oomph anywhere else to make up for it. Consumer spending grew at the same meager rate as GDP itself, with an outright decline in spending on durable goods, the big ticket purchases that consumers postpone when they’re worried about the economy. Nonresidential investment and housing made modest positive contributions.
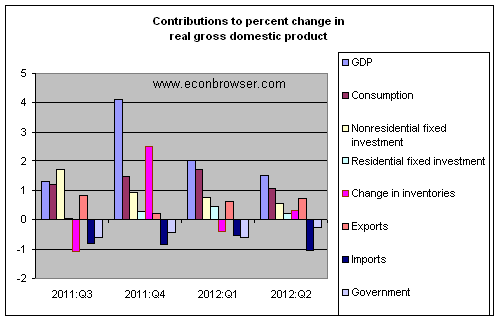
And things have been “disappointing” like this for quite a while. Although the 2011:Q4 growth has been revised up to what might seem to be an encouraging 4.1% value, most of this was inventory accumulation; growth in real private spending for Q4 was 1.6%, the same sort of anemic numbers we’d been seeing before and since.
Even so, we’d still unambiguously describe the economy as continuing to experience overall economic growth. The latest GDP report puts our Econbrowser Recession Indicator Index at 5.7%. For purposes of calculating this number, we allow one quarter for data revision and trend recognition, so the latest value, although it uses today’s released GDP numbers, is actually an assessment of where the economy was as of the end of the first quarter of 2012. The index would have to rise above 67% before our algorithm would declare that the U.S. had entered a new recession.
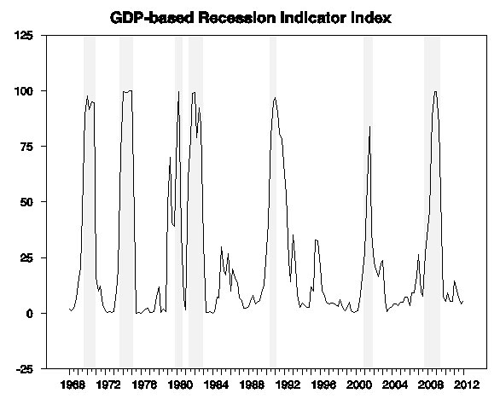
GDP-based recession indicator index. The plotted value for each date is based solely on information as it would have been publicly available and reported as of one quarter after the indicated date, with 2012:Q1 the last date shown on the graph. Shaded regions represent dates of NBER recessions, which were not used in any way in constructing the index, and which were sometimes not reported until two years after the date.
Not a recession, and not really a surprise, but nonetheless very discouraging. The graph below plots the level of real GDP on a logarithmic scale, so that a vertical move of 1 unit on this graph corresponds to a 1% change in the level of real GDP. U.S. real GDP today is up only 2.9% from where we were 5 years ago. That’s worse– by far– than any 5-year postwar period before 2007. Even 1983:Q2, which marked the low point in the second of back-to-back recessions, saw a level of GDP 6.7% above that in 1978:Q2. And even if you don’t start counting until the current recovery began, we’ve only seen an average annual real GDP growth rate since 2009:Q2 of 2.2%, significantly worse than the 2.6% average annual growth rate during the disappointing and discouraging 2002:Q1-2007:Q4 economic expansion. Oh, for the good old days!
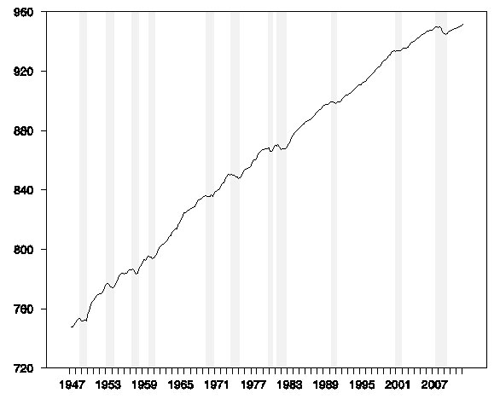
100 times the natural log of U.S. real GDP, 1947:Q1-2012:Q2.
I still see potential for a large temporary boost from housing and autos. However, there is also potential for a much bigger negative shock from both fiscal policy and developments in Europe. Aside from these issues, there seems reason also to be concerned about what looks to be a long-run trend of declining U.S. growth. Time for us all to ask again, what could America be good at?
Disclaimer: This page contains affiliate links. If you choose to make a purchase after clicking a link, we may receive a commission at no additional cost to you. Thank you for your support!


Leave a Reply