The Fed announced it would begin tapering bond purchases next month. Wall Street rejoiced, pushing the major averages back up toward new highs.
However, the taper news won’t help you make money in the markets in 2014. But understanding two important four-year market cycles just might…
Get ready. We are entering the second year of the presidential cycle — which is also a midterm election year. Historically, these are not strong years for stocks.
“An average U.S. business cycle lasts four years, which happens to also coincide with a four-year presidential term,” explains stockcharts.com’s John Murphy. “As a result, it’s often called the presidential cycle. According to the Stock Traders Almanac, the two first years of the four-year cycle are usually the worst with the last two usually the best. Bear markets usually occur during the first two years. Since 2013 (the first year of this term) was so strong, historical odds for 2014 (the second year) to suffer a downside correction are pretty high.”
This idea fits in well with my guess that the market will peak sometime in the late winter or early spring before drifting lower. No crash, per se. But a mild market correction would not be out of the question.
However, the presidential cycle doesn’t necessarily get the last word. The other four-year cycle (also called the Kitchin Cycle) has diverged from the regularly-scheduled presidential cycle…
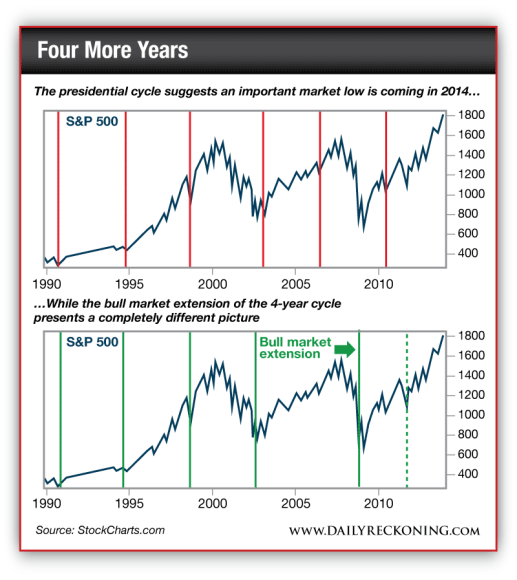
Allowing for a bull market extension gives us some leeway (and adds a bit of confusion) to the picture. I think this view of the four-year cycle holds more weight, simply because it gives us freedom to line up cycle lows with more meaningful bottoms. For example, the 2006 low was hardly important when you consider the 2008 crash. Extensions like these are rare—and they usually lead to nasty market corrections.
“There have been only three times in the past when the four-year cycle low occurred more than four years after the prior low,” explains renowned technician Walter Deemer. “All of them ended very badly.”
No kidding…
Not only did we get the big crash that bottomed out in 2009—we also saw a 19% correction and meaningful low in 2011—just a little more than two years after the initial cycle bottom.
So what does it all mean?
If we add the Kitchin cycle analysis to our presidential cycle picture, it points to a milder market correction this time around. With two major market lows in the books within the past five years, this potential midterm correction won’t be the end of the world…
Leave a Reply