Interest rates on government debt for a number of European countries– notably Greece, Portugal, Ireland, Italy, and Spain– shot up considerably during 2010-2012. Those yields have fallen significantly from their peaks, though these five countries still face higher borrowing costs than most other countries in Europe.
Yields on long-term government bonds, Jan 2009 to April 2013. Data source: Eurostat.
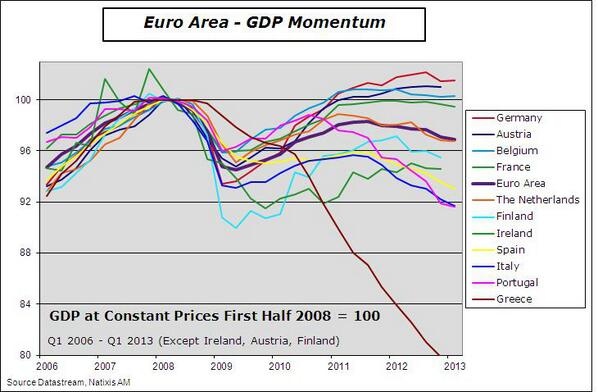
Europe has now been in an economic recession for a year and a half, with Eurostat reporting that the 17 EU countries had an average drop of real GDP of 0.6% in 2012. But real GDP in the 5 countries just mentioned fell 2.5%, while in the other 12 it grew by 0.2% during 2012.
Source: Brad Plumer.
It’s not hard to see a connection between the earlier fiscal problems and the current economic woes. The conservative spin is that a lack of fiscal restraint in 2004-2006 in countries like Greece and Portugal left them vulnerable to the subsequent sovereign debt scares, with the recession of 2007-2009 then putting enough new pressure on government budgets to push these countries into unsustainable debt burdens. Skyrocketing sovereign debt yields, in addition to the stresses all this placed on the banking system, meant tighter credit for every borrower, and this credit crunch was a key factor that pushed the countries back into recession.
The liberal spin is that too much fiscal constraint in 2011-2012 constituted a new contractionary shock, and that fiscal austerity is a key factor in Europe’s double-dip recession.
Both views have some validity. But I would also want to stress a third channel. One of the reasons some countries got into bigger debt problems than others is that they faced a more serious deterioration of economic fundamentals. For example, Ireland and Spain had quite low sovereign debt loads going into 2007. But the collapse of property price bubbles brought big losses to the banking systems. The main reason Ireland went from one of the lowest debt loads to one of the higher is because the government ended up injecting such a huge sum into the banking system. But as we know well from the recent U.S. experience (not to mention centuries of data from other countries), a collapse in property prices and private-sector financial distress can have lingering effects from which it takes a long time to recover. Thus both the the fiscal challenges of 2010-2012 and the recession of 2012-2013 have some common underlying causes.
Where do we stand now in terms of the fiscal outlook? Greece managed to relieve some of its burden with the PSI default in March of last year, producing the first decline in its debt/GDP ratio in 5 years. But the IMF projects that this year’s deficit and falling nominal GDP will be enough to undo all of that, with debt for 2013 a bigger multiple of GDP than it had been in 2011.
Greek net debt as a percentage of GDP as realized over 2002-2012 and projected for 2013-2018. Data source: IMF World Economic Outlook Database.
Even with an interest rate of 8%, paying the interest on a debt of 175% of GDP requires the country’s taxpayers to give up 14% of their annual gross income just to make interest payments on the debt, that is, just to keep debt from growing, even if the rest of the budget was somehow already balanced. That’s not going to happen– the Greek situation is clearly unsustainable. That Greece is able to borrow at such a low rate could only reflect lenders’ conviction that broader Europe is on the hook to pick up much of the bill.
Doubters of that simple arithmetic often point to Japan, whose net debt as a percent of GDP is projected by the IMF to exceed that of Greece by 2017. Yet Japan can borrow today at a 0.8% annual interest rate, and the government’s plans for further fiscal expansion appear to have boosted the country’s fortunes considerably. How can Japan get away with this while Greece cannot?
Historical realized and projected future net debt as a percentage of GDP for assorted countries, 2000-2018. Data source: IMF World Economic Outlook Database.
One key difference is that Japan has been running large current-account surpluses, while Greece has a big current-account deficit. With its high saving rate and extreme home bias for investment, Japan hasn’t needed to rely on international lenders to fund its budget deficit. Another is that Japan, unlike Greece, can pay its bills simply by creating more currency. And if currency creation does lead to higher inflation, a little inflation would be quite helpful for the Japanese economy. But it will be very interesting to see how markets adjust to the new reality that Japan is going to experience some inflation. Particularly with a declining Japanese saving rate, Japan’s fiscal situation is no more sustainable in the long run than Greece’s, and something has to give here.
And what’s the latest outlook for the U.S. fiscal situation? The U.S. Congressional Budget Office has just released new budget projections for the next decade, which are a little more favorable than its previous assessment. The CBO now anticipates that U.S. deficits will fall significantly as a percent of GDP over the next few years before beginning to rise again each year after 2016.
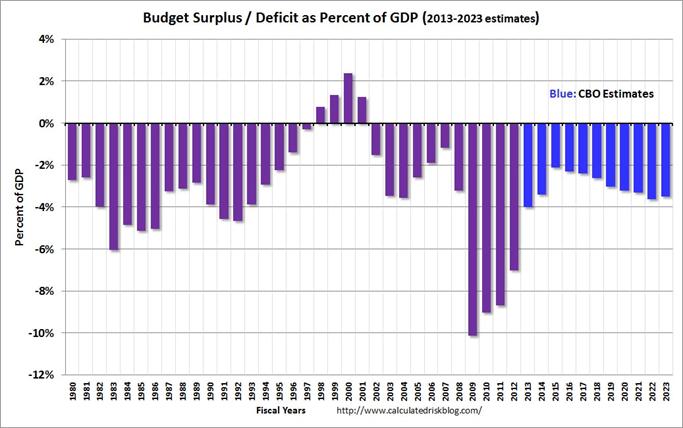
(click to enlarge)
New CBO projections of U.S. federal government surplus as percent of GDP. Source: Calculated Risk.
The latest CBO projection implies that the U.S. debt-to-GDP ratio will fall for the next few years and then start to rise.
Source: CBO.
The primary factor driving the rising deficits and debt after 2016 is the CBO’s assumption that interest rates will start to return to more historically normal levels. The current low interest rate means that the total interest expense on U.S. debt is currently fairly low despite our high debt levels. But the CBO is projecting that as interest rates rise, by 2020 net interest expense will exceed the total defense budget and exceed total nondefense discretionary spending.
Source: CBO.
Even if it’s true that a lack of fiscal restraint by Greece and Portugal in 2004-2006 contributed to their current woes, that does not imply that fiscal contraction in 2013 is going to help them. The time for relevant policy advice from that insight would have been 2004-2006 when there was still a chance to do something about it, not 2013 when there are no good options available.
And I believe that it would be a mistake if the U.S. were to allow government debt to grow faster than GDP after 2016.
Disclaimer: This page contains affiliate links. If you choose to make a purchase after clicking a link, we may receive a commission at no additional cost to you. Thank you for your support!


Leave a Reply