Earlier this year, disruptions in Libya and the resurgence of demand from the emerging economies sent oil prices up sharply, a development that many economists believe contributed to the slow growth for 2011:H1. The chaotic markets of the last few weeks saw oil prices drop back down to where they had been in December. Will that be enough to revive the struggling U.S. economy? There is some evidence suggesting that it may be too late.
I recently completed a survey of a large number of academic studies that found a nonlinear economic response to oil price changes. One very well-established observation is that although oil price increases were often associated with economic recessions, oil price decreases did not bring about corresponding economic booms. For example, when oil prices plunged in the mid-1980s, the oil-producing states in the U.S. experienced what looked like their own regional recession. An oil price increase that just reverses a recent price decrease does not seem to have the same economic effects as a price move that establishes new highs.
One measure that has sometimes been used to summarize these effects is to compare the price of oil today with where it has been over the last year. If oil prices are at a higher level than they’ve been over the previous year, I’ll denote by pt the percentage change over the previous high. On the other hand, if oil prices have recently been higher than they are now, pt is zero, where I’m measuring the price of oil by the producer price index for crude petroleum as of the last month of quarter t. It’s interesting to take a look at how this measure is related to the quarter t real GDP growth rate, denoted yt (measured at an annual rate). The regression below, estimated over 1949:Q2 to 2011:Q1, summarizes a forecast of this quarter’s GDP growth based on GDP growth over the previous 4 quarters and what oil prices had been doing the previous 4 quarters. [Cognoscente will recognize this as equation (3.2) in a paper I published in 2003 (working paper version here), re-estimated with new data that have arrived since then and quoting real GDP growth rates at an annual rate rather than a quarterly rate as in the original; standard errors are in parentheses.]

The equation implies that if oil prices are steady or falling (so that pt-j has been zero for some time), we’d expect to see real GDP growth averaging about 4% at an annual rate. But when oil prices are making new highs, we expect slower growth. It is interesting that the biggest effects on GDP come 3 or 4 quarters after oil prices have gone up. This is not a result unique to this specification, but is something one finds whether one uses linear or a variety of nonlinear specifications and regardless of the data set. We often see some economic responses right away, such as a drop in consumer sentiment, fall in sales of less energy-efficient vehicles, or build up of inventories. But it usually takes some time for the effects of these to be multiplied as they ripple through the rest of the economy.
To illustrate the implications of the above regression, suppose that the price of oil increases by 10% in quarter t over its high for the previous year, with no subsequent increases beyond that. The figure below plots the predicted consequences for the GDP growth rate in quarter t+j as a function of j, how many quarters it’s been since the price went up. Four quarters after the increase, we might expect to see real GDP in that quarter growing almost 1.4% slower at an annual rate than it otherwise would have. [Note this is not simply a plot of the lagged coefficients on pt-j because it also incorporates dynamic feedback arising from the lagged coefficients on yt-j].
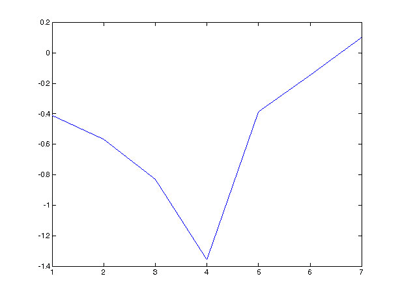
Horizontal axis: number of quarters following a quarter in which the price of oil exceeds its previous high by 10%. Vertical axis: predicted change in GDP growth rate for that quarter.
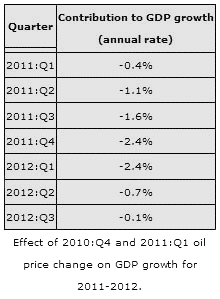 The price of oil (as measured by the end-of-quarter value for the crude oil producer price index) was 9% higher at the end of 2010 than it had been over the previous year, and the price went up an additional 15% from there during 2011:Q1. The table to the right indicates how much these changes would be predicted to affect GDP growth based on the equation above. For example, if in the absence of the earlier oil price increases we would have seen real GDP growing at a 4% annual rate, given the 2010:Q4-2011:Q1 oil price increases, we would only expect 2.4% growth for 2011:Q3 and 1.6% growth for 2011:Q4 and 2012:Q1. Note that, according to the above relation, it would make no difference for that prediction whether oil prices decline dramatically in 2011:Q3 and 2011:Q4.
However, a number of other nonlinear relations could fit the data as well or better, and some of these have dramatically different predictions from the equation above. In my 2003 study, I found the evidence favored a specification with a longer memory, looking at where oil prices had been not just over the last year but instead over the last 3 years. My reading of developments during 2011 has been that, because of the very high gasoline prices we saw in 2008, U.S. car-buying habits never went back to the earlier patterns, and we did not see the same shock to U.S. automakers as accompanied some of the other, more disruptive oil shocks. My view has been that, in the absence of those early manifestations, we might not expect to see the later multiplier effects that account for the average historical response summarized in the figure above. If one uses the 3-year price threshold that the data seem to favor (e.g., equation (3.8) in my 2003 study), the inference would be that we’ll do just fine in 2011:H2, because oil prices in 2011 never exceeded what we saw in 2008.
Even using the 1-year threshold, the above relation still says that the 2010-2011 oil price increases would not be enough by themselves to bring about a recession, but would only mean slow growth for the end of this year and beginning of next. But of course, the concern is that this is not the only shock that may be hitting the economy. I continue to worry a great deal about possible consequences of credit disruptions and fiscal contraction from the unsettled situation in Europe.
It’s worries about these developments, and what they would mean for world petroleum demand, that have been the most important factors bringing oil prices down. And that most assuredly should not be read as good news for the U.S. economy.
Disclaimer: This page contains affiliate links. If you choose to make a purchase after clicking a link, we may receive a commission at no additional cost to you. Thank you for your support!


Leave a Reply