With the advanced economies at a critical juncture, some economists are urging more fiscal stimulus while others argue that raising debt levels will stunt growth. This column presents the Reinhart-Rogoff findings on the relationship between debt and growth based on data from 44 countries over 200 years with a focus on the debt-growth link during high-debt episodes.
Economics has been under fire since the recent crisis for enshrining abstract models that offer little connection to the real world. In “Growth in a Time of Debt,” our data-intensive approach aims at providing stylized facts, well beyond selective anecdotal evidence, on the contemporaneous link between debt, growth, and inflation at a time in which the world wealthiest economies are confronting a peacetime surge in public debt not seen since the Great Depression of 1930s and indeed virtually never in peacetime. As Paul Krugman (2009) observed, “they’ll (the economists) have to do their best to incorporate the realities of finance into macroeconomics.” One might add as a corollary, however, that such discipline is especially needed when those realities are inconvenient to strongly held opinions.
And you don’t have to look far these days to find such strong opinions about the fork-in-the-road facing advanced economies when it comes to debt. There is no shortage of recommendations for either path, see, for example, the Vox columns by Calvo (2010), Corsetti (2010), and Giavazzi (2010) last month.
In a recent paper, we studied economic growth and inflation at different levels of government and external debt (Reinhart and Rogoff 2010a). The public discussion of our empirical strategy and results has been somewhat muddled. Here, we attempt to clarify matters, particularly with respect to sample coverage (our evidence encompasses 44 countries over two centuries – not just the US), debt-growth causality (our book emphasises the bi-directional nature of the relationship), as well as nonlinearities in the debt-growth connection and thresholds evident in the data. These are fundamental points that seem to have been lost in some of the commentary.
In addition to clarifying the earlier results, this column enriches our original analysis by providing further discussion of the high-debt (over 90% of GDP) episodes and their incidence. Some of the implications of our analysis, including for the US, are taken up in the final section.
We begin by reiterating some of the main results of Reinhart and Rogoff (2010a).
The basic exercise and key results
Our analysis was based on newly compiled data on forty-four countries spanning about two hundred years. This amounts to 3,700 annual observations and covers a wide range of political systems, institutions, exchange rate arrangements, and historic circumstances.
The main findings of that study are:
- First, the relationship between government debt and real GDP growth is weak for debt/GDP ratios below 90% of GDP.1 Above the threshold of 90%, median growth rates fall by 1%, and average growth falls considerably more. The threshold for public debt is similar in advanced and emerging economies and applies for both the post World War II period and as far back as the data permit (often well into the 1800s).
- Second, emerging markets face lower thresholds for total external debt (public and private) – which is usually denominated in a foreign currency. When total external debt reaches 60% of GDP, annual growth declines about 2%; for higher levels, growth rates are roughly cut in half.
- Third, there is no apparent contemporaneous link between inflation and public debt levels for the advanced countries as a group (some countries, such as the US, have experienced higher inflation when debt/GDP is high). The story is entirely different for emerging markets, where inflation rises sharply as debt increases.
Figure 1 summarises our main conclusions as they apply to the 20 advanced countries in our 44-country sample. We will concentrate here on the advanced countries, as that is where much of the public debate is centred.2
In the figure, the annual observations are grouped into four categories, according to the ratio of debt-to GDP during that particular year. Specifically years when debt-to-GDP levels were:
- below 30 percent;
- 30 to 60 percent;
- 60 to 90 percent; and
- above 90%.3
The bars show average and median GDP growth for each of the four debt categories. Note that of the 1,186 annual observations, there are a significant number in each category, including 96 above 90%. (Recent observations in that top bracket come from Belgium, Greece, Italy, and Japan.)
From the figure, it is evident that there is no obvious link between debt and growth until public debt exceeds the 90% threshold. The observations with debt to GDP over 90% have median growth roughly 1% lower than the lower debt burden groups and mean levels of growth almost 4% lower. (Using lagged debt does not dramatically change the picture.) The line in Figure 1 plots the median inflation for the different debt groupings – which makes clear that there is no apparent pattern of simultaneous rising inflation and debt.
Figure 1. Government debt, growth, and inflation: Selected advanced economies, 1946-2009
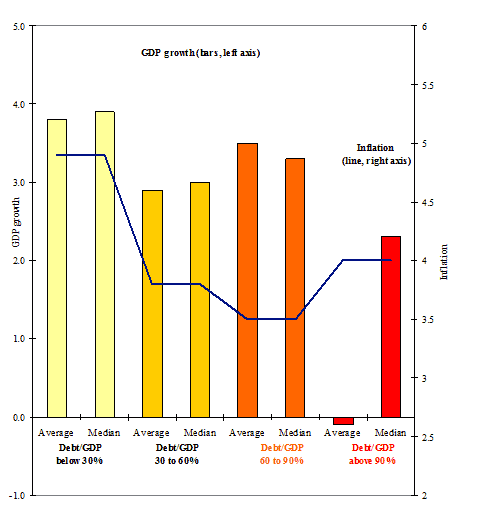
Notes: Central government debt includes domestic and external public debts. The 20 advanced economies included are Australia. Austria, Belgium, Canada, Denmark, Finland, France, Germany, Greece, Ireland, Italy, Japan, Netherlands, New Zealand, Norway, Portugal, Spain, Sweden, the UK, and the US. The number of observations for the four debt groups are: 443 for debt/GDP below 30%; 442 for debt/GDP 30 to 60%; 199 observations for debt/GDP 60 to 90%; and 96 for debt/GDP above 90%. There are 1,180 observations. Sources: Reinhart and Rogoff (2010a) and sources cited therein.
High-debt episodes in the sample
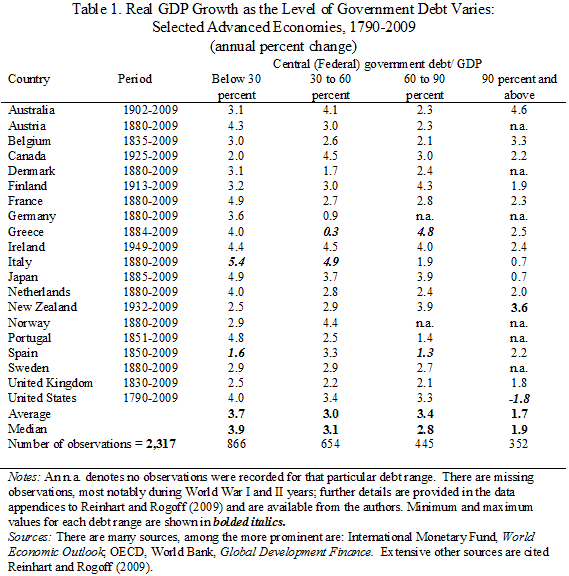
The episodes that attract our interest are those where debt levels were historically high. As convenient as it is to focus exclusively on a particular country or a single episode for a single country (like the US around World War II, where the data is readily available, or an interesting ongoing case, like Japan), the basis for an empirical regularity is multiple observations. Because our data span 44 countries with many going back to the 1800s or (at least the beginning of the 19th century), our analysis is based on all the episodes of high (above 90%) debt for the post World War II period; for the pre-war sample it covers all those that are encompassed by the availability of data. Table 1 (from Reinhart and Rogoff 2010a) describes the coverage and the basic statistics for the various debt levels for the advanced economies.4
It is common knowledge that the US emerged after World War II with a very high debt level. But this also held for Australia, Canada, and most markedly the UK, where public/debt GDP peaked at near 240% in 1948. These cases from the aftermath of World War II are joined in our sample by a number of peacetime high-debt episodes:
- the 1920s and 1980s to the present in Belgium,
- the 1920s in France,
- Greece in the 1920s,
- 1930s and 1990s to the present,
- Ireland in the 1980s,
- Italy in the 1990s,
- Spain at the turn of the last century,
- the UK in the interwar period and prior to the 1860s and, of course,
- Japan in the past decade.
As will be discussed, episodes where debt is above 90% are themselves rare and, as shown in Table 1, a number of countries have never had debt entries above 90%.
Debt thresholds and nonlinearities: the 90% benchmark
Thresholds and non-linearities play a key role in understanding the relationship between debt and growth that should not be ignored in casual re-interpretations.
(i) Thresholds. Those who have done data work know that mapping vague concepts like “high debt” or “overvalued exchange rates” into workable definitions requires arbitrary judgments about where to draw lines; there is no other way to interpret the facts and inform the discussion. In the case of debt, we worked with four data “buckets”: 0-30%, 30-60%, 60-90%, and over 90%. The last one turned out to be the critical one for detecting a difference in growth performance, so we single it out for discussion here.
Figure 2 shows a histogram of public debt-to-GDP as well as pooled descriptive statistics (inset) for the advanced economies (to compliment the country-specific ones shown in Table 1) over the post World War II period.5 The median public debt/GDP ratio is 0.36; about 92% of the observations fall below the 90% threshold. In effect, about 76% of the observations were below the 60% Maastricht criteria.
Put differently, our “high vulnerability” region for lower growth (the area under the curve to the right of the 90% line) comprises only about 8% of the sample population. The standard considerations about type I and type II errors apply here.6 If we raise the upper bucket cut-off much above 90%, then we are relegating the high-debt analysis to case studies (the UK in 1946-1950 and Japan in recent years).
Only about 2% of the observations are at debt-GDP levels at or above 120% – and that includes the aforementioned cases. If debt levels above 90% are indeed as benign as some suggest, one might have expected to see a higher incidence of these over the long course of history. Certainly our read of the evidence, as underscored by the central theme of our 2009 book, hardly suggests that politicians are universally too cautious in accumulating high debt levels. Quite the contrary, far too often they take undue risks with debt build-ups, relying implicitly perhaps on the fact these risks often take a very long time to materialise. If debt-to-GDP levels over 90% are so benign, then generations of politicians must have been overlooking proverbial money on the street.
We do not pretend to argue that growth will be normal at 89% and subpar (about 1% lower) at 91% debt/GDP any more than a car crash is unlikely at 54mph and near certain at 56mph. However, mapping the theoretical notion of “vulnerability regions” to bad outcomes by necessity involves defining thresholds, just as traffic signs in the US specify 55mph (these methodology issues are discussed in Kaminsky and Reinhart 1999).
Figure 2. The 90% debt/GDP threshold: 1946-2009, advanced economies
Probability density function
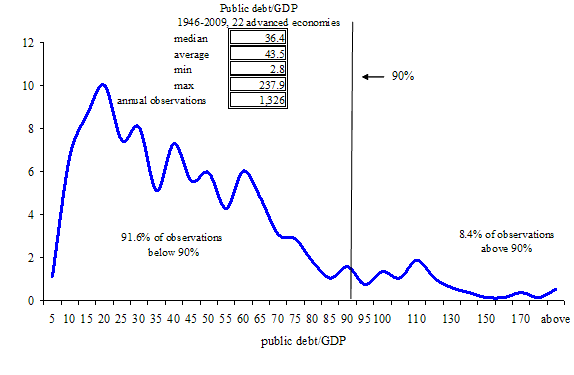
Notes: The advanced economy sample is the complete IMF grouping (Switzerland and Iceland were added). It includes Australia. Austria, Belgium, Canada, Denmark, Finland, France, Germany, Greece, Iceland, Ireland, Italy, Japan, Netherlands, New Zealand, Norway, Portugal, Spain, Sweden, Switzerland, the UK, and the US. Sources: Reinhart and Rogoff (2009 and 2010a).
(ii) Nonlinear relationship. We summarised the results in our paper by writing:
“the relationship between government debt and real GDP growth is weak for debt/GDP ratios below a threshold of 90% of GDP. Above 90%, median growth rates fall by 1%, and average growth falls considerably more.” Reinhart and Rogoff (2010a)
Revisiting Figure 1 is useful for illustrating the importance of nonlinearities in the debt-growth link. Simply put, for 92% of the observations in our sample there is no systematic link between debt and growth (Bruno and Easterly 1998 find similar results). Thus, if we did a simple scatter plot of all the observations on debt/GDP and on growth we might expect to find a “clouded mess.” We can highlight this general point with the US case. As noted in the working paper version of Reinhart and Rogoff (2010a), for the period 1790-2009, there are a total of 216 observations of which 211 (or 98%) are below the 90% debt to GDP cutoff.7 It should be quite obvious that a scatter plot of the US data would not be capable of revealing a systematic pattern (as demonstrated in the work Iron and Bivens 2010). Indeed, this example illustrates one of our main results, that there is no systematic relationship between debt and growth below a threshold of 90% of GDP.
Debt and growth causality
As discussed, we examine average and median growth and inflation rates contemporaneously with debt. Temporal causality tests are not part of the analysis. The application of many of the standard methods for establishing temporal precedence is complicated by the nonlinear relationship between growth and debt (more of this to follow) that we have alluded to.
But where do we place the evidence on causality? For low-to-moderate levels of debt there may or may not be one; the issue is an empirical one, which merits study. For high levels of debt the evidence points to bi-directional causality.
Growth-to-debt: Our analysis of the aftermath of financial crisis Reinhart and Rogoff (2008) presents compelling evidence for both advanced and emerging markets over 1800-2008 on the fiscal impacts (revenue, deficits, debts, and sovereign credit ratings) of the recessions associated with banking crises; see Figure 3.
As we sum up,
“Banking crises weaken fiscal positions, with government revenues invariably contracting. Three years after a crisis central government debt increases by about 86%. The fiscal burden of banking crisis extends beyond the cost of the bailouts.” Reinhart and Rogoff (2008).8
There is little room to doubt that severe economic downturns, irrespective whether their origins was a financial crisis or not, will, in most instances, lead to higher debt/GDP levels contemporaneously and or with a lag. There is, of course, a vast literature on cyclically-adjusted fiscal deficits making exactly this point.
Figure 3. Cumulative increase in public debt in the three years following the banking crisis
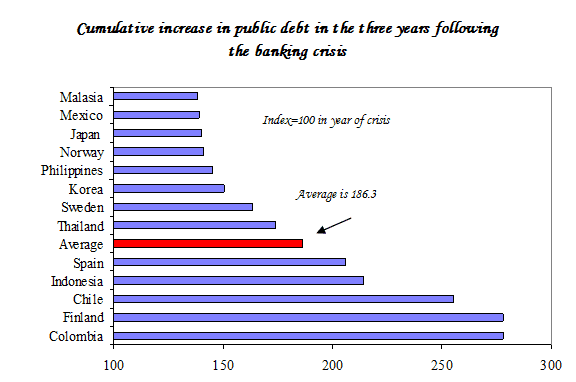
Source: Reinhart and Rogoff (2008).
Debt-to-growth: A unilateral causal pattern from growth to debt, however, does not accord with the evidence. Public debt surges are associated with a higher incidence of debt crises.9 This temporal pattern is analysed in Reinhart and Rogoff (2010b) and in the accompanying country-by-country analyses cited therein. In the current context, even a cursory reading of the recent turmoil in Greece and other European countries can be importantly traced to the adverse impacts of high levels of government debt (or potentially guaranteed debt) on county risk and economic outcomes. At a very basic level, a high public debt burden implies higher future taxes (inflation is also a tax) or lower future government spending, if the government is expected to repay its debts.
There is scant evidence to suggest that high debt has little impact on growth. Kumar and Woo (2010) highlight in their cross-country findings that debt levels have negative consequences for subsequent growth, even after controlling for other standard determinants in growth equations. For emerging markets, an older literature on the debt overhang of the 1980s frequently addresses this theme.
Implications and US policy
One need look no further than the stubbornly high unemployment rates in the US and other advanced economies to be convinced how important it is to develop a better understanding of the growth prospects for the decade ahead. We have presented evidence – in a multi-country sample spanning about two centuries – suggesting that high levels of debt dampen growth. One can argue that the US can tolerate higher levels of debt than other countries without having its solvency called into question. That is probably so.10 (see Reinhart and Reinhart 2007). We have shown in our earlier work that a country’s credit history plays a prominent role in determining what levels of debt it can sustain without landing on a sovereign debt crisis. More to the point of this paper, however, we have no comparable evidence yet to suggest that the consequences of higher debt levels for growth will be different for the US than for other advanced economies. It is an issue yet to be explored.
Figure 4, which plots total (public and private) credit market debt outstanding for the US during 1916 to 2010:Q1 makes this point clear.11 Despite considerable deleveraging by the private financial sector, total debt remains near its historic high in 2008. Total public sector debt during the first quarter of 2010 is 117% of GDP. It has only been higher during a one-year stint at 119% in 1945. Perhaps soaring US debt levels will not prove to be a drag on growth in the decades to come. However, if history is any guide, that is a risky proposition and over-reliance on US exceptionalism may only prove to be one more example of the “This Time is Different” syndrome.12
For many if not most advanced countries, dismissing debt concerns at this time is tantamount to ignoring the proverbial elephant in the room.
Figure 4. Total (public and private) credit market debt outstanding: US, 1916-2010Q1
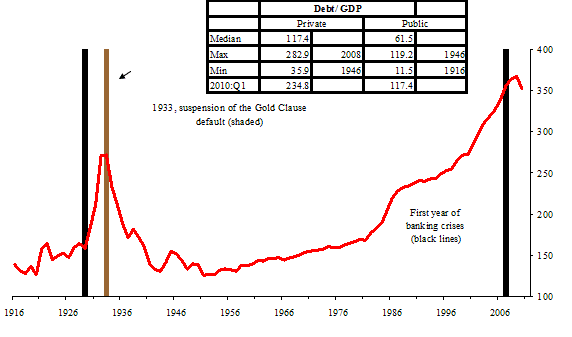
Sources: Historical Statistics of the US, Flow of Funds, Board of Governors of the Federal Reserve International Monetary Fund, World Economic Outlook
References
•Bruno, Michael and William Easterly (1998), “Inflation Crises and Long-Run Growth,” Journal of Monetary Economics, 41(1), February, 3-26.
•Kaminsky, Graciela, and Carmen M Reinhart (1999), “The Twin Crisis: The Causes of Banking and Balance of Payments Problems”, American Economic Review, 89(3), 473-500, June.
•Kumar, Mohan, and Jaejoon Woo (2010), “Public Debt and Growth”, IMF Working Paper WP/10/174, July.
•Iron, John S and Josh Bivens (2010), “Government Debt and Economic Growth”, Economic Policy Institute Briefing Paper 271, July.
•Krugman, Paul (1979), “A Model of Balance of Payments Crisis”, Journal of Money Credit and Banking, 11(3), August, 311-325.
•Laeven, Luc and Fabian Valencia (2010), “Resolution of Banking Crises: The Good, the Bad, and the Ugly”, IMF Working Paper, 10/46, June.
•Reinhart, Carmen M. and Vincent R. Reinhart (2008), “Is the U.S. Too Big to Fail?” VoxEU, May 2010.
•Reinhart, Carmen M and Kenneth S Rogoff (2009), This Time is Different: Eight Centuries of Financial Folly. Princeton University Press.
•Reinhart, Carmen M and Kenneth S Rogoff (2010a), “Growth in a Time of Debt” American Economic Review, May. (Revised from NBER working paper 15639, January 2010.)
•Reinhart, Carmen M and Kenneth S Rogoff (2010b), “From Financial Crash to Debt Crisis”, NBER Working Paper 15795, March. Forthcoming in American Economic Review.
•Reinhart, Carmen M and Vincent Reinhart (2007), “Is the US too big to fail?”, VoxEU.org, 17 November.
•Reinhart, Carmen M, Miguel A Savastano, and Kenneth S Rogoff (2003), “Debt Intolerance”, in William Brainard and George Perry (eds.), Brookings Papers on Economic Activity. (An earlier version appeared as NBER Working Paper 9908, August 2003.)
•Calvo, Guillermo (2010), “To spend or not to spend: Is that the main question”, VoxEU.org, 4 August.
•Corsetti, Giancarlo (2010), “Fiscal consolidation as a policy strategy to exit the global crisis”, VoxEU.org, 7 July.
•Giavazzi, Francesco (2010), “The “stimulus debate” and the golden rule of mountain climbing”, VoxEU.org, 22 July 2010.
——
1 In this paper “public debt” refers to gross central government debt. “Domestic public debt” is government debt issued under domestic legal jurisdiction. Public debt does not include obligations carrying a government guarantee. Total gross external debt includes the external debts of all branches of government as well as private debt that issued by domestic private entities under a foreign jurisdiction.
2 The comparable emerging market exercises are presented in the original paper.
3 The four “buckets” encompassing low, medium-low, medium-high, and high debt levels are based on our interpretation of much of the literature and policy discussion on what are considered low, high etc. debt levels. It parallels the World Bank country groupings according to four income groups. Sensitivity analysis involving a different set of debt cutoffs merits exploration, as do country-specific debt thresholds along the broad lines discussed in Reinhart, Rogoff, and Savastano (2003).
4 The interested reader is referred to the original paper for the comparable emerging market table.
5 Our sample includes 24 emerging market countries.
6 The null hypothesis is whatever “normal” growth is versus the alternative of lower growth.
7 Figure 3 in the NBER WP is not included in the published version of the paper.
8 See Section IV devoted to fiscal consequences in Reinhart Rogoff (2008), see also Laeven and Valencia (2010).
9 For a model where credit-financed government deficits lead to a currency crisis, see Krugman (1979).
10 Indeed, this is the central argument in Carmen M. Reinhart and Vincent R. Reinhart (2010) originally published in November 17, 2008).
11 Flow of Funds aggregate the private and public sectors, where the latter is comprised of federal (net), state and local and government enterprises. To reiterate, this is not the public debt measure used in our historical analysis, which is gross central government debt (which for the U.S. is at present about 90 percent of GDP).
12 The “This Time is Different Syndrome” is rooted in the firmly-held beliefs that: (i) Financial crises and negative outcomes are something that happen to other people in other countries at other times (these do not happen here and now to us);(ii) we are doing things better, we are smarter, we have learned from the past mistakes; (iii) as a consequence, old rules of valuation are not thought to apply any longer.
![]()
Disclaimer: This page contains affiliate links. If you choose to make a purchase after clicking a link, we may receive a commission at no additional cost to you. Thank you for your support!

Leave a Reply