“If you are going to use probability to model a financial market, then you had better use the right kind of probability. Real markets are wild.” – Benoit Mandelbrot (1924-2010)
I’m going to show you a different way of looking at the world of finance.
Most people assume that things like stock prices and interest rates tend to bounce around some kind of long-term average. Outliers, most think, will tend to draw back to some middle ground of past experience.
For example, the 10-year Treasury pays 2.5% today. People look back and see what rates have been for the last 20 or 30 years. They were much higher. So the assumption is that rates in the future will pull toward something closer to that experience.
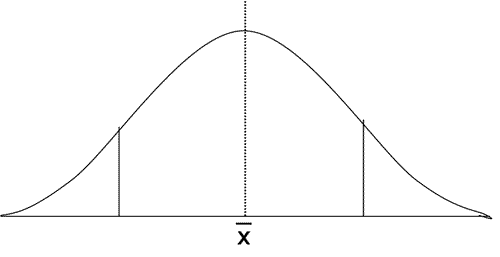
This is a common way of looking at the world. It’s a Gaussian perspective, named after the famous mathematician Carl Friedrich Gauss. It is perhaps most known by the simple bell curve:
But a 19th-century French mathematician named Augustin-Louis Cauchy had a different idea. It is best told by using the story of the blindfolded archer. Cauchy’s idea better represents the reality of financial markets. It also shows you the folly of using models that rely on long-run averages of the past.
Before I get to that, I want to point out the bell curve assumes a stable average (or x). It also defines the odds. Outliers are rare events under the bell curve. The odds of events happening at the end of the tails approach zero.
The problem is the markets are far, far wilder than the model suggests. Wacky, extreme events occur far more than the bell curve says they should.
Now, for the blindfolded archer…
The story comes from Benoit Mandelbrot, in his book The (Mis)behavior of Markets. Imagine a blindfolded archer. He stands before an infinitely long wall with a target on it. Now assume he takes many, many shots at the target.
Most of these shots will miss. Some won’t even hit the wall. Some will miss by hundreds of yards. Now tally up his shots and distances from the target. What will the average look like?
Here is Mandelbrot:
“Our archer is not in the land of the bell curve… His scores for blindfolded archery never settle down to a nice, predictable average and a consistent variation around that average. In the language of probability, his errors do not converge to a mean.”
With a seeing archer, you’d expect his shots to bunch up around the target. Wild shots would be rare. And you’d expect they wouldn’t be all that far off. But Cauchy’s view of the world has the wild shots occurring frequently. And the misses can be wide.
“The difference between the extremes of Gauss and of Cauchy could not be greater,” Mandelbrot writes.
Mandelbrot maintains — and I think proves — that markets are closer to Cauchy than Gauss. There are many small movements, the sort of day-to-day nickel-and-dime trading. But there are very large movements mixed in. Wild shots off by hundreds of yards. And the impact of these is huge.
A couple of examples from Mandelbrot:
- In the 1980s, 40% of the positive gains on the S&P 500 came from just 10 trading days
- From 1986-2003, half of the decline of the U.S. dollar against the yen came on just 10 trading days out of 4,695 days.
Thus, relying on an average is a tricky business in finance. There really isn’t a meaningful average when the extremes can have such a huge impact.
Consider again the yield on the 10-year Treasury at 2.5%. Most people would say that’s low because they are comparing it with what they know from the last 20 or 30 years. But if you go back further, it may not seem so low. In the 1930s, the average for the decade was 2.98%. (This according to A History of Interest Rates, Fourth Ed.). In the 1940s, it was 2.54%. In the 1950s, 2.99%. That’s 30 years where the U.S. Treasury rate started with a 2. This just shows you what’s possible. And that our own situation could last far longer than it has and not even be an historical outlier.
Also, I like this table, published in Van Hoisington’s second-quarter letter:
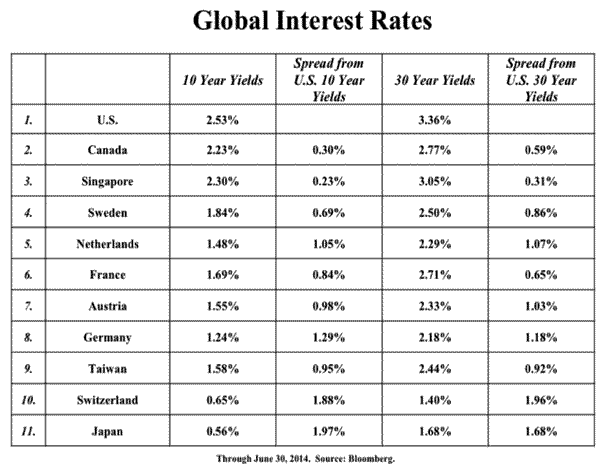
U.S. 10-year Treasuries are the highest on the list. Suddenly, 2.5% doesn’t seem so low. I’m not saying interest rates won’t go higher. I’m just trying to get you to change your perspective a bit, to look at the world a little differently.
Markets don’t have to adhere to what went on before. Past averages — whether of price-earnings ratios or interest rates or commodity prices — have little real value. (The famed Shiller price-earnings ratio, which is based on average earnings for the last 10 years? Forget it.)
Charts of prices and data are just recorded history. They do not define how the market — that blindfolded archer — will take his next shot.
Leave a Reply