Inflation or deflation… economy bad, economy better… it’s a massive ball of confusion, so let’s see if we can very simply take a look at the BIG picture to see where we are and where we are heading.
In 1971 President Nixon removed the Dollar entirely from the gold standard. Rapid inflation immediately followed to the point that in 1980, then Fed Chairman Paul Volcker raised interest rates to 20% effectively killing the concept of Usury.
From the peak in interest rates in 1980 until 2008 interest rates where in a structural decline and have now reached zero as seen by this chart of the Effective Federal Funds Rate:
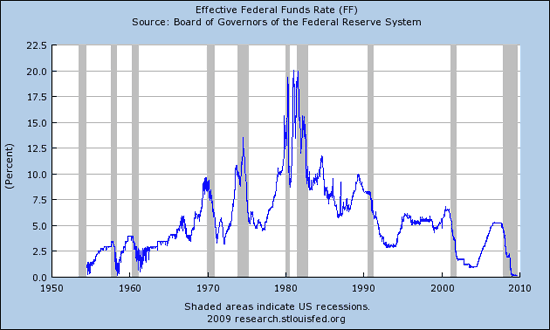
Note that with each recession (shadow areas), interest rates went lower, then lower, then lower, then zero.
They will NOT go below zero (don’t quibble, I know what you micro-managers are thinking, we’re looking at the big picture).
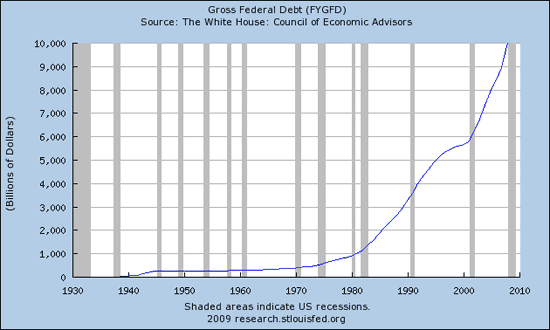
While interest rates were declining, DEBT was GROWING. This is what I call the era of leverage. Debt is financial leverage, and when interest rates are declining, holding debt gets easier and easier. The more debt that everyone has, the more credit dollars they have to drive up the price of houses, of cars, of gasoline, of food, of everything – to a point.
Here is a chart of the gross federal debt from about the late 1930s. Note that the DEBT began its parabolic rise shortly after interest rates began to decline:
Here is a chart of Total Public debt from about 1967. Note that the growth was slow and steady until about the peak in interest rates (1980), it then rose much more swiftly until the year 2000 when the move went parabolic and now is pointing almost literally straight up:
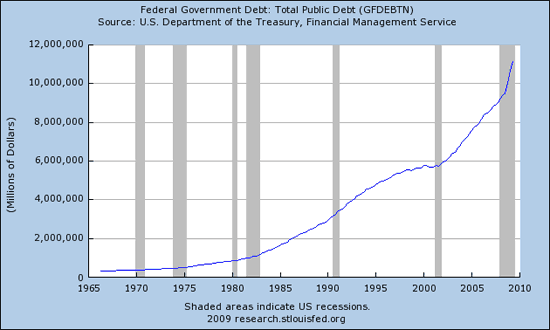
Guess what? That is not going to continue like that forever.
It takes INCOME to service debt. When the income no longer grows, if debt saturation has occurred, then debt must fall as the ability to pay it back falls with income. Here is what personal income is doing:
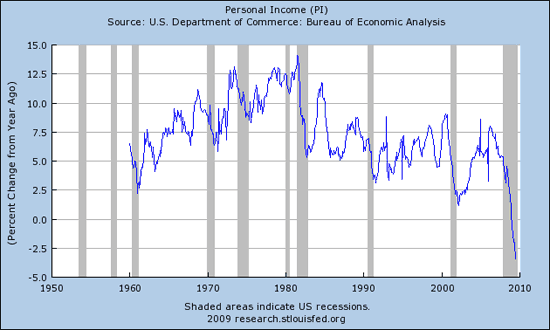
Personal Income is FALLING.
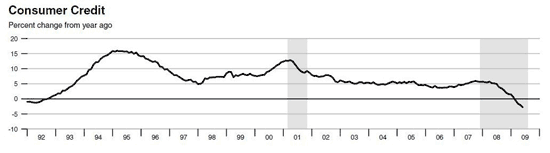
Consumer Credit is FALLING.
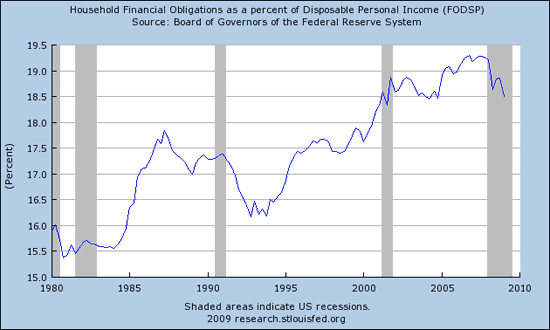
Household financial obligations are falling.
That would be an appropriate response, would it not?
Yet, in our own government, their income is falling:
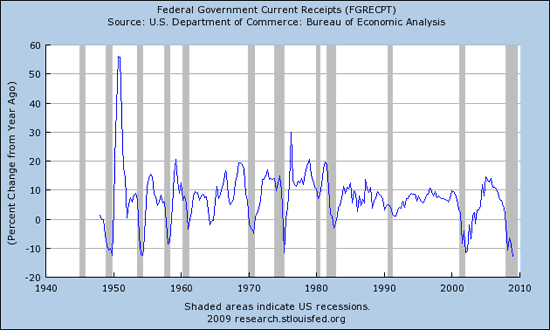
Yet, their debt is growing exponentially. NOT an appropriate relationship unless bankruptcy is your goal.
Consumers who have less credit available spend less money. International trade falls. Corporate profits, those at least marked to reality, fall… and therefore stocks go up, right?
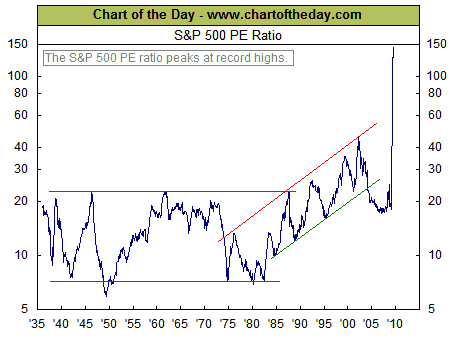
Of course there’s a historic disconnect there somewhere, if only I could put my finger on it… hmmm. It’s Sooooo difficult to figure out, why heck, NO ONE could have seen any of the financial turbulence coming.
And what are those same “visionaries” now saying about the stock market? Oh boy.
Once again, the people who see near term inflation are looking at the money supply charts, but they are not seeing the destruction in credit dollars which, I believe, is vastly greater than even the government charts show due to the leverage/deleverage of the shadow banking system that cannot be clearly seen. What can be clearly seen is that the big banks, who comprise the shadow banking world, make BIG profits when they MARK their “assets” TO their own MODEL, yet they have losses when they are forced to MARK them even slightly TO MARKET reality.
So, as interest rates have declined to zero, debt and incomes grew until incomes could no longer support further growth in debt and now they are both falling back. After all, the people who actually PRODUCE REAL THINGS in the rest of the world will produce for far, far less than we will. Thus in a more open international trade market, one would expect wages here to fall and wages there to rise, meeting someplace in the middle.
To confuse this otherwise pretty clear picture, the Fed jumps in and begins printing money. Why? Because the real economy can no longer support the paper economy. They have lowered interest rates to zero and so the next thing to do is to print.
Now let’s look at the chart of Federal Funds Rate again…

Note that following each recession and each lowering of rates there is a rebound that requires rates to rise, but in the past 30 years, never as high as they were before. In the 2000 to 2003 recession rates were lowered by Greenspan to just 1% – almost zero but not quite. And he did not have to resort to open printing. The next cycle rates hit zero AND they had to print.
Let me ask you this, what happens on the next cycle? People seem to want to argue with that chart, but zero is zero. There are only two possible paths of motion, sideways or up – OR self destruction. Trust me on this, zero is NOT any more normal than 20%!
We are at the end of an era, the era of leverage. We are now staring down the end of a loaded gun with our own finger on the trigger. We can choose to normalize interest rates and suck up the fact that debts don’t grow forever, OR we can pull the trigger and continue to print and to run up debts that we cannot service. The latter is fiscal and governmental suicide. The latter will lead to a loss of confidence in government and the demise of the dollar. That is NOT INFLATION!! That is a LOSS OF CONFIDENCE in a fiat money system, two different things – they are not just a matter of degree.
And thus CHANGE is COMING. You and I both hope that our leaders do not pull that trigger and commit suicide – so far they are doing exactly that, I can hear the click, I’m waiting for the BOOM.
————————————————
Lately I’ve been showing the latest issues of the St. Louis Fed’s Monetary Trends and they have been popular, so here is the latest issue out for September. A couple of things I want to point out… first is that in each issue the first couple of pages are devoted to an opinion piece by one of their staff economists.
I usually ignore these as they are usually, well… frankly, they are just bologna. And this one is no exception!
However, it’s an interesting subject in which Mr. Wheelock presents a false hypothesis and then, surprise, comes to a false conclusion. Evidently his goal is to tell the world How NOT to Reduce Excess Reserves. His premise is that in the Great Depression they tightened monetary policy too quickly and thus caused another recession in the late 1930s.
Again, he is 180 degrees out from reality regarding cause and effect. Had monetary policy not been far too lose in the 1920s, then the credit bubble they allowed and subsequently collapsed, would have never required them to ramp excess reserves in the first place.
The Shadow Banking system took credit creation to an extreme FAR beyond that of the 1920s. Again, we are at the end of the line and we have a choice. Mr. Wheelock’s choice seems to be that we need to do it all over again, only for longer and on a bigger scale. Great thinking.
The second thing I’d like to point out regarding the Monetary Trend paper is that you need to look at the top of each page to see when the charts were updated. Most of the charts in this issue are the same as I showed last week, but there are a few different chart series in each issue…
——
I’ve already thoroughly gone over the contraction in credit and collapse of monetary velocity, those charts have not been updated in this issue over last.
So let’s talk about something else. Something interesting is that back in the 1930s some economic formulas were created that are obviously still in use today and are included in this report from the Fed.
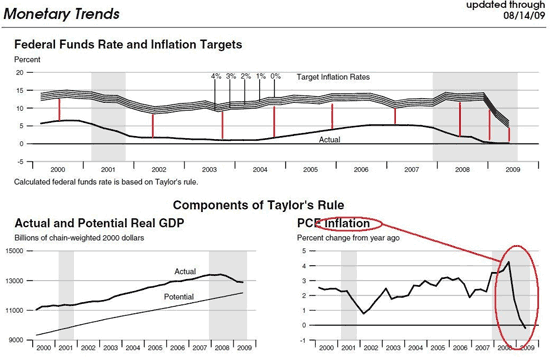
Specifically, there are charts and projections using the Taylor Rule whereby the formula he created predicts an economic growth rate based upon target inflation rates.
In the charts below, first note what’s happening with PCE inflation in the lower right. Then go up and note that the ACTUAL Federal Funds Rate has stayed consistently way beneath the Taylor Target rates… until, that is, just recently. What this chart is saying to me is that the formula is now calling for a sharp reduction in rates. But wait, rates hit zero! So what did we do? PRINT. Will that work to bring everything back in line? If so, for how long? And then what? Hmmm… that’s an interesting chart. I dug around and tried to find some long term historical charts, but they are inconsistent in showing the Taylor calculation. Surprise, the charts presented by people from the Fed seem to suggest that their rates match and follow the Taylor Rule very well, while some others seem to be calculated in a different way. Let’s just watch this chart over time, as long as it’s calculated consistently, then we may be able to glean something from Mr. Taylor’s formula:
Then there’s the McCallum Rule. Here’s how Investopedia defines it:
What Does McCallum Rule Mean?
A monetary policy development guideline developed by economist Bennett T. McCallum. The rule describes the relationship between inflation and the growth in the money supply needed to create that level of inflation. Important inputs in this model are the target inflation rate and the long-term average rate of growth in real GDP.When the economic statistics of the 1970s are used to back-test the McCallum rule, it shows that at least part of the effect that contributed to that era’s economic downturn was the fact that it grew too rapidly, which ultimately lead to high levels of inflation.
However, the McCallum rule only describes one part of the story, as other economic models determined that the interest rates set by the Fed were also too low. Because the cost of borrowing was not high enough, individuals would simply borrow to spend instead of saving.
So, Taylor’s rule describes the relationship of interest rates to economic growth, McCallum’s rule describes the relationship between interest rates needed to produce a specified rate of inflation. Let’s see how that’s working:
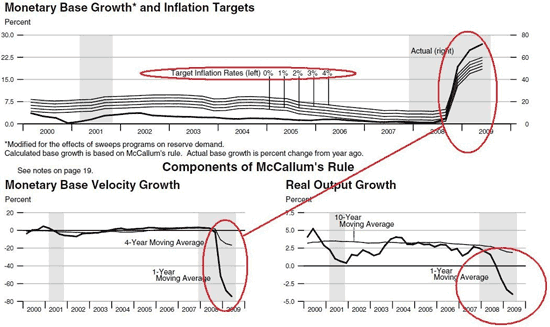
The top chart seems to suggest that in order to create, let’s say, 2% inflation, that the Fed would have to increase the money base by a whopping 55%, LOL!! And that’s what they’ve done, and then some – currently to the tune of over 95%!!!
Note, however, what happens to monetary base velocity growth when you throw that much money into the system. And then note what has actually happened to Real Output Growth, a number I would contend is vastly overstated.
Bottom line to me is that these rules are obviously not perfect and that the further you go into the realms of extremes, the further they break down. WHY? DEBT is why. There must be sufficient income to service debt, and it is not there.
The next step out in the scale of the extreme will be when people lose CONFIDENCE in the monetary system and in our government. That will NOT be INFLATION, that will be the end of the system. Don’t pull the trigger.
Did that help, or are you still a ball of confusion?
- Bulenox: Get 45% to 91% OFF ... Use Discount Code: UNO
- Risk Our Money Not Yours | Get 50% to 90% OFF ... Use Discount Code: MMBVBKSM
Disclaimer: This page contains affiliate links. If you choose to make a purchase after clicking a link, we may receive a commission at no additional cost to you. Thank you for your support!


Thanks for putting all of that together. It is quite informative. OK, I’ll be honest, I’m going to need to reread it at least several more times before I understand it all ;-)
I suspect I’ll remain somewhat confused about how a US investor can best preserve their wealth in real terms in this type of environment. Any suggestions regarding the mix of asset classes and ratios?
“Volcker raised interest rates to 20% effectively killing the concept of Usury.”
The bankssters teach that usury is excessive interest but Ezekiel mentions the wicked if he who exacts usury OR excessive interest. Ezekiel knew they were not the same and people who think they are the same have been fooled.
From my http://johnturmel.com/poembibl.htm
Ezekiel declared that usury and interest,
Could have a different effect, there was a simple test.
If interest demanded is of something that can breed,
Such interest is payable and not sin I concede.
So if you lend a hundred head and ask to get two more,
That might not be excessive lending that He would abhor.
But if you gain all of the calves and he still owes you some,
That would be judged excessive, that is more than maximum.
And if the interest is on some silver or some gold,
It’s usury because there are no babies to behold!
It’s interest if principal can breed to multiply,
It’s usury if principal cannot so classify.
Jct: So usury creates a mort-gage death-gamble among borrowers trying to all come up with Principal + Interest when they all borrowed only the Principal.
Call this the error that fools the whole of mankind into permitting the death-gamble to be inflicted on borrowers because excessive death is bad but a little bit of death is okay?
the problem with the construct is that the rates are only zero for financial institutions.
the banks and investment banks have “captured” all the capital funds and “made”profits, but the actual capital released to the public is enormously expensive on the retail market. no consumer is paying nearly zero for his mortgage loan or his credit card debt.
the banks as the intermediaries are the culprits in the drama of economic paralysis.
the system has to crash to allow a new order and rule to come to the fore. we have not felt the pain the it will take to re-tool the world economy.
no-one wants to self destruct, but the government and the banking system have all “drunk the kool-aid” already. the posion has to do its work.