The conventional wisdom is that the income of the American middle class, ‘The Bottom 99 Percent”, has been stagnating or even shrinking, with most or all growth having gone to the rich.
However, thought inequality has unquestionably been rising rapidly, the conventional wisdom is wrong, the result of measurement problems. The debate has focused on income distribution, ignoring that even the highest estimates of rising inequality are too small to eat up all the gains to the middle class. The central problem is underestimation of total growth.
Wages, household earnings and earnings of tax units appear to have been growing slowly. Real average wages and compensations grew only 15 percent between 1970-2008 based on BLS data. Real median household income grew 16 percent 1970-2008 according to U.S Census. The average Taxable Income of the bottom 99% grew 12 percent 1970-2008 according to Pickety and Saez.
The problem is that this contrasts with another figur. Real Per Capita GDP increasing by 108 percent 1970-2008, based on the National Accounts data calculated by the Bureau of Economic Analysis. We are talking about a more reliable and complete measure than the three sources of data cited above (Wages, Household Income, and Taxable Income). This number is for example used by the OECD.
How can per capita income grow by 108 percent, but the income of the middle class by a fraction? According to the conventional wisdom, the answer is simple. We know inequality has been increasing during this period, so the rich must have taken the rest of growth. According to Pickety and Saez analyses of taxable income, the share going to the top one percent increased from 9 percent in 1970 to 21 percent in 2008. Mystery solved!
Wrong. Rising inequality alone as estimated by Pickety and Saez and others cannot explain rising GDP per capita while the middle class stagnates.
Let’s go back to Pickety and Saez, and their oft-reported figures. Based on to their tax data real average taxable growths only 29 percent between 1970-2008, including the top one percent (and including capital gains).
This is not a major problem for estimating relative inequality, but it is a huge problem for estimating levels. GDP grew four times as much as the data Pickety and Saez rely on, even when all the rich are included.
There are at least three explanations:
1. Taxable income is only part of total national income (total GDP). In 2008 taxable income as used by Pickety and Saez was only 58 percent of GDP, a sizable decline from 1970. We can’t just ignore the rest of national income. The base of the BLS wage data is even smaller, something like one third of GDP.
2. Average Household and taxable unit sizes have been shrinking since 1970. Households and “Tax Units” have been growing at one and a half time the rate of population.
3. Inflation is systematically miss-measured, as the Boskin-comission demonstrated. When calculating GDP a different number is used than the commonly used CPI-U-RS, which accounts for part of the difference. http://www.blogger.com/img/blank.gif
The Congressional Budget Office made their own estimates, accounting for the first two problems, though not inflation. They CBO confirms that the share of post-tax income going to the top one percent increased from 8 percent to 17 percent (a little lower than Pickety and Saez, probably because of adjustment for household size and has a broader definition of income).
The CBO finds that average income grew 62 percent, close to per capita GDP number of 68 percent for the shorter time period they look at. Because of this, their estimates of income growth of the middle class is far higher.
A methodical study by University of Chicago economist Bruce Meyer and coauthor James Sullivan corrects for the problems mentioned above, finding that real median income rose about 50 percent 1980-2008. This is lower than the 69 percent per capita GDP growth. The difference is explained by growing income inequality.
Burkhauser et al. (2011) do some adjustment, and arrive at the figure of 37 percent for real median income increase 1979-2007.
In a paper titled “Has the Rise in American Inequality Been Exaggerated?” Northwestern University Robert Gordon, also does some http://www.blogger.com/img/blank.gifhttp://www.blogger.com/img/blank.gifadjustments, arriving at 52 percent growth of median household income.
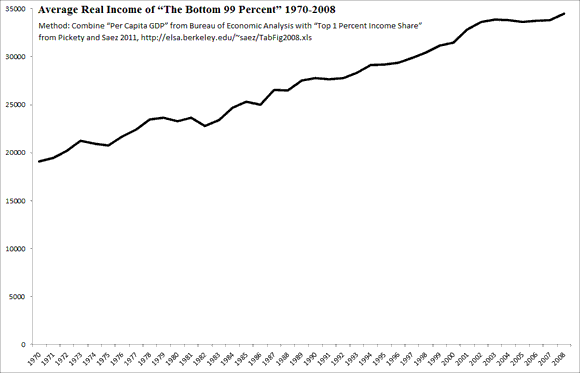
My own simple method is combining the best inequality estimate (from Pickety and Saez) with the best growth estimates (from GDP numbers). For measuring income growth, rather than income inequality, Pickety and Saez tax based estimates are inferior to GDP numbers.
This method shows that that between 1970-2008 the real per capita income of the “Bottom 99 percent” grew by 80 percent, and the “Bottom 90 percent” grew by 60 percent.
Ironically, this method also raises the growth of the top one percent. Pickety and Saez underestimate total growth, so they find that the top one percent “only” became 3 times richer. Using GDP numbers, and their income share estimates, this goes up to 4.8!
Measuring this way the top one percent took 25 percent of an average 1.9 percent real income growth between 1970-2008.
Pickety and Saez instead find that the top one percent took close to 60 percent of what they estimate to be an average 0.7 percent real income growth between 1970-2008.
Let me emphasize, I don’t question Pickety and Saez income distribution estimates, just their estimates of U.S growth, where three quarters of GDP growth is missing.
Increase in Real Median Income:
Census 16% (not-adjusted, 1970-2008)
CBO 35%(partially adjusted, 1979-2007)
Burkhauser+: 37%(adjusted 1979-2007)
Meyer&Sullivan: 50% (adjusted 1980-2008)
Gordon: 52% (adjusted 1979-2007)
Increase in Real Average Income of bottom 99 percent:
Pickety and Saez: 12%(not-adjusted, 1970-2008)
CBO 46%, (partially adjusted, 1979-2007)
Combining Pickety and Saez & GDP: 80% (adjusted, 1970-2008)
To claim middle class stagnation you need to either make sure income including the that of the rich is growing at a pace comparable to GDP, unless you want to say that the GDP numbers are wrong and the indirect partial estimates right (a claim I have never seen, though I am hardly an expert).
Many economists and journalists make a qualitative rather than quantitative judgment here “We know inequality is rising, so if we observe very low estimates of middle class growth the rich must be taking the rest”.
But do the numbers add up? Accepting the GDP data, for there to be stagnation in the income of the bottom 99 percent since 1970, the share of income going to the top one percent would have needed to be 56 percent! (rather than the 21 percent estimate of Pickety and Saez and the 17 percent post-tax estimate of the CBO).
- Bulenox: Get 45% to 91% OFF ... Use Discount Code: UNO
- Risk Our Money Not Yours | Get 50% to 90% OFF ... Use Discount Code: MMBVBKSM
Disclaimer: This page contains affiliate links. If you choose to make a purchase after clicking a link, we may receive a commission at no additional cost to you. Thank you for your support!

“How can per capita income grow by 108 percent, but the income of the middle class by a fraction?”
Per capita income accounts for those at the top seeing a disproportionate rate of income growth over 30 years, with the top 1% rising over 270% between 1979 and 2007.
“between 1970-2008 the real per capita income of the “Bottom 99 percent” grew by 80 percent, and the “Bottom 90 percent” grew by 60 percent.”
This is done by mixing growth in per capita income, which melds in the growth of the bottom 99% with the turbulently high rates of growth for the top, which leads to high overall levels of per capita income with the top’s income share, which still yields a prettier picture of income growth for most Americans than reality reflects.
As FDR says, “The millionaire and the pauper has an average income of $50,000”