Post-Recession Pattern of Jobless Claims

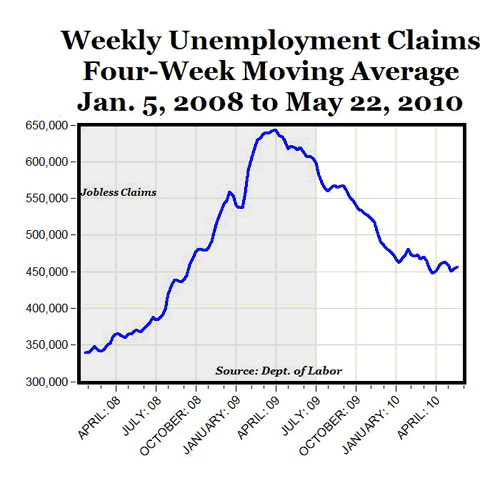
Weekly jobless claims were released today, showing a decrease of 14,000 from last week, while the four-week moving average moved up by 2,250 to 454,250 claims (see chart above). After a significant decline of almost 200,000 claims from about 650,000 in April 2009 to close to 450,000 weekly claims by early this year, the decline in weekly claims has slowed quite a bit in recent months, levelling out at about 450,000. But that recent levelling and chopiness shouldn’t create too much concern, since that pattern of jobless claims is to be expected in the first year or two following a recession.

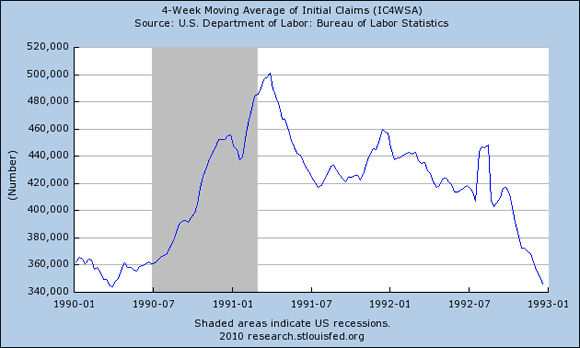
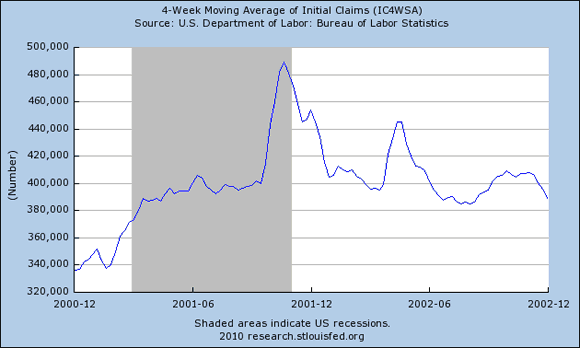
For example, notice the pattern of jobless claims (4-week moving average) in the graphs below following the 1990-1991 recession and the 2001 recession. Both post-recession periods expereienced sharp declines in the early stages of recovery, followed by long periods of flattening and even some periods of upticks:

1990-1991 recession:

2001 recession:

Disclaimer: This page contains affiliate links. If you choose to make a purchase after clicking a link, we may receive a commission at no additional cost to you. Thank you for your support!

About Mark J. Perry 262 Articles

Affiliation: University of Michigan

Dr. Mark J. Perry is a professor of economics and finance in the School of Management at the Flint campus of the University of Michigan.

He holds two graduate degrees in economics (M.A. and Ph.D.) from George Mason University in Washington, D.C. and an MBA degree in finance from the Curtis L. Carlson School of Management at the University of Minnesota.

Since 1997, Professor Perry has been a member of the Board of Scholars for the Mackinac Center for Public Policy, a nonpartisan research and public policy institute in Michigan.

Visit: Carpe Diem

Be the first to comment

Leave a Reply

Your email address will not be published.


*

This site uses Akismet to reduce spam. Learn how your comment data is processed.