Both have to be “handled with care”.
Revisions
We’re all tempted to make predictions on the basis of the last data point. And even more difficult to resist is the temptation to make definitive statements on the basis of data that are sure to be revised. For instance, we see this question from Casey Mulligan, “Where’s the GDP Disaster?“.
Last October, when we were told that spending and incomes were about to collapse, I predicted that “real GDP will not drop below $11 trillion (chained 2000 $).”
Professor Mulligan provides this graph.
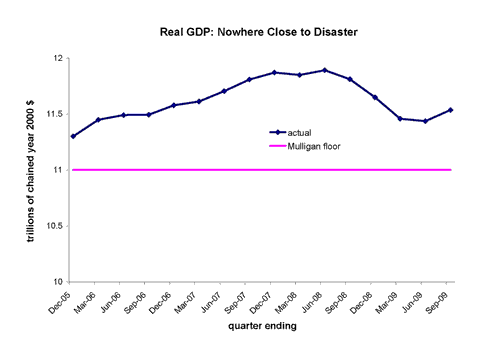
Figure from Mulligan, “Where’s the GDP Disaster?“
I think this is an excellent time to recapitulate the hazards of making definitive assessments on the basis of data that are sure to be revised [0] [1]. To illustrate this point, I go back to the last recession, which according to the NBER extended from 2001Q1-01Q4.
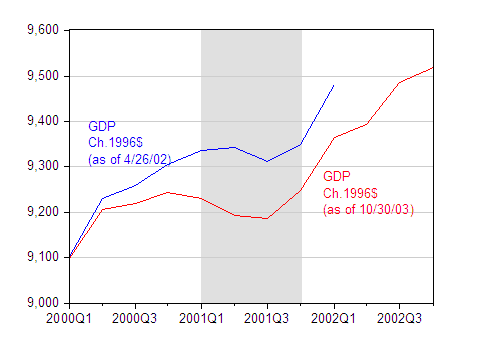
Figure 1: GDP in billion Ch.1996$, SAAR, according to the April 26, 2002 and October 30, 2003, advance releases. NBER defined recession dates shaded gray. Source: St. Louis Fed ALFRED.
I plot the vintages of GDP in Ch.1996$ available as of April 2002 (the advance release for the first quarter after the recession ended), and October 2003 (advance release for 2003Q3).
Note that GDP in the latter vintage was 1.6% lower (in log terms) in 2001Q2 than it was in the corresponding period according to the earlier vintage. This amounted to a 5 billion Ch.1996$ difference.
Now, I replicate Professor Mulligan’s graph. I draw Professor Mulligan’s floor, along with real GDP, and an alternate for 09Q1-09Q2 that would obtain if GDP turned out to be 1.6% lower in a later vintage.
Figure 2: GDP in billion Ch.2000$, SAAR. GDP calculation involves deflating nominal GDP by the base year 2000 deflator, obtained by dividing the 2005-base chain deflator by .88648 (the value of the 2005-base deflator in 2000). The “alternate GDP path” applies the difference between the April ’02 and October ’03 estimates of 2001Q2 GDP (in log terms). NBER defined recession dates shaded gray, assuming recession ends in 09Q2. Source: St. Louis Fed ALFRED, NBER and author’s calculations.
I calculate GDP in Ch.2000$ by dividing the 2005-base chained price index by the average value of the index in 2000, which is 88.648, and then dividing nominal GDP by this base-year-2000 index.
The graph indicates that in 09Q2, GDP was only 2.3% above Mulligan’s floor.
And Conditional Forecasts
In some sense, the critical aspect of Professor Mulligan’s argument that the events of 2008-09 were never going to be disasterous is that he made his projection conditional on none of the extraordinary measures undertaken by the Fed, nor on the the fiscal stimulus by the Federal government being implemented. It’s useful to recap his statement from October:
NO DEPRESSION; NO SEVERE RECESSION
The medium term fundamentals point toward more real GDP, more employment, and (to a lesser degree) more consumption. Some employment and real GDP declines may occur in the short run, but they will be small by historical standards. Professor Cooley recently explained “The losses to date represent less than .5% of the work force. In the relatively mild recession of 2001 to 2002, job losses equaled about 1% of the work force. In the much more severe recession of 1981 to 1982, job losses totaled nearly 3% of the labor force–six times today’s figure. And in the (truly) Great Depression–invoked, now, with an alarmist frequency–job losses between 1929 and the trough in 1933 were 21% of the labor force.” Note that 21% over 3 1/2 years is an average decline of 2% every quarter for 14 consecutive quarters! If employment declines 2% in even one quarter, or 5% over a full year, I will admit well before 2010 that a severe recession is happening and that my 2010 forecasts are unlikely to be attained.
According to the BLS, national nonfarm employment was 136,783,000 (SA) at the end of 2006, as the housing price crash was getting underway. Real GDP was $11.4 trillion (chained 2000 $). Barring a nuclear war or other violent national disaster, employment will not drop below 134,000,000 and real GDP will not drop below $11 trillion. The many economists who predict a severe recession clearly disagree with me, because 134 million is only 2.4% below September’s employment and only 2.0% below employment during the housing crash. Time will tell.
Now, I assume that Mulligan feels free to compare a forecast conditioned on no fiscal policy against one with fiscal policy to the extent he believes multipliers are near zero or even negative. And perhaps he believes money is neutral in the short run. If so, then of course it’s fine to make the comparisons he does. But for those of us who believe that monetary and fiscal policy have textbook effects, then making that comparison is problematic. In the absence of these stimulus measures, I believe we may very well have breached that 11 trillion floor.
To see this, consider CBO’s assessment that by 2009Q4, the stimulus package would have an impact of between 1.4 to 3.8 ppts of baseline GDP. The midpoint is 2.6 ppts. That’s well within the range of the Mulligan floor.
So, to conclude, in my view, a “GDP disaster” would have occurred in the absence of aggressive actions by the Federal Reserve, the US Government, as well as fiscal and monetary authorities abroad.
On Revisions and on Conditioning
- Bulenox: Get 45% to 91% OFF ... Use Discount Code: UNO
- Risk Our Money Not Yours | Get 50% to 90% OFF ... Use Discount Code: MMBVBKSM
Disclaimer: This page contains affiliate links. If you choose to make a purchase after clicking a link, we may receive a commission at no additional cost to you. Thank you for your support!


This guy has no idea what his is talking about. This is not a GDP disaster avoided but delayed and made even bigger.