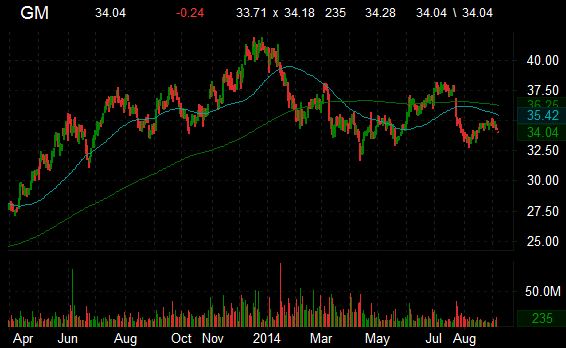
Recent short interest data for the 8/15/2014 settlement date shows a decrease in short interest for shares of General Motors Company (GM). As of August 15, the automaker’s short interest totaled 30,247,321 shares, as compared to 36,892,668 shares since July 31, a decline of -18.01 %. Average daily volume [AVM] for the same period fell by 4.6M to 11,133,221 shares from 15,755,205 shares. It is worth noting that ticker’s short interest has declined by more than 13.5M shares, or 30.97%, from the 6/30/2014 settlement date.
Based on the latest AVM, the days-to-cover ratio — a metric that includes both the total shares short and the average daily volume of shares traded — is currently 2.71 days. Days-to-cover for GM decreased to 2.71 for the August 15 settlement date, as compared to 2.34 days at the July 31 report.
General Motors has a beta of 1.77 and a short float of 2.20%. In the past 52 weeks, shares of the Detroit, Michigan-based company have traded between a low of $31.70 and a high of $41.85 and are now at $34.28. Shares are down 4.34% year-over-year and 15.39% year-to-date.
The chart below shows where the equity has traded over the last year, with the 50-day and 200-day moving averages included.
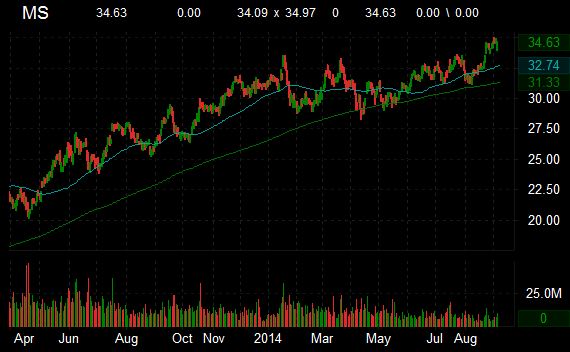
Recent short interest data for the 8/15/2014 settlement date shows a decrease in short interest for shares of Morgan Stanley (MS). As of August 15, the investment bank’s short interest totaled 17,514,597 shares, as compared to 18,752,927 shares since July 31, a decline of -6.60 %. Average daily volume [AVM] for the same period fell by 2.11M to 7,410,384 shares from 9,527,698 shares. It is worth noting that ticker’s short interest has decreased by more than 12.5M shares, or 41.68%, from the 11/29/2013 settlement date.
Based on the latest AVM, the days-to-cover ratio — a metric that includes both the total shares short and the average daily volume of shares traded — is currently 2.36 days. Days-to-cover for MS fell to 2.36 for the August 15 settlement date, as compared to 1.96 days at the July 31 report.
Morgan Stanley has a beta of 2.80 and a short float of 1.20%. In the past 52 weeks, shares of the New York-based company have traded between a low of $26.41 and a high of $34.99 and are now at $34.63. Shares are up 29.17% year-over-year, and down 10.43% year-to-date.
The chart below shows where the equity has traded over the last year, with the 50-day and 200-day moving averages included.
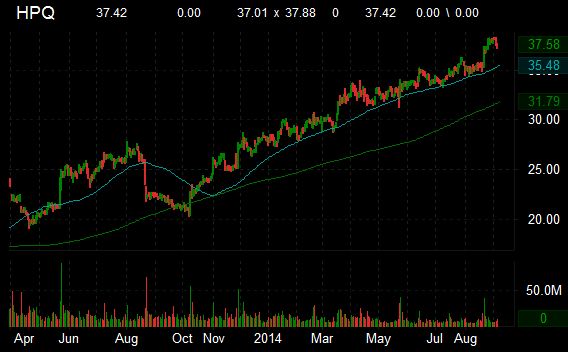
Recent short interest data for the 8/15/2014 settlement date shows an increase in short interest for shares of Hewlett-Packard Company (HPQ). As of August 15, the short interest for one of the world’s largest computer and electronics companies totaled 30,289,490 shares, as compared to 29,307,052 shares since July 31, an increase of 3.35 %. Average daily volume [AVM] for the same period fell by 2.65M to 7,377,626 shares from 10,033,444 shares. It is worth noting that ticker’s short interest has jumped by almost 5M shares, or 19.07%, from the 4/30/2014 settlement date.
Based on the latest AVM, the days-to-cover ratio — a metric that includes both the total shares short and the average daily volume of shares traded — is currently 4.10 days. Days-to-cover for HPQ increased to 4.10 for the August 15 settlement date, as compared to 2.92 days at the July 31 report.
Hewlett-Packard has a beta of 1.72 and a short float of 1.60%. In the past 52 weeks, shares of the Palo Alto, California-based company have traded between a low of $20.25 and a high of $38.25 and are now at $37.42. Shares are up 67.62% year-over-year and 34.31% year-to-date.
The chart below shows where the equity has traded over the last year, with the 50-day and 200-day moving averages included.
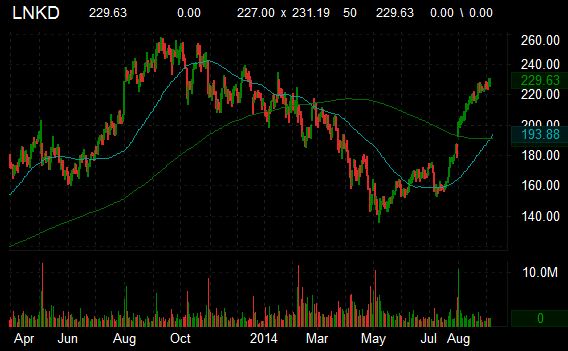
Recent short interest data for the 8/15/2014 settlement date shows an increase in short interest for shares of LinkedIn Corporation (LNKD). As of August 15, the short interest for the world’s largest professional network totaled 6,385,183 shares, as compared to 5,411,748 shares since July 31, a jump of 17.99 %. Average daily volume [AVM] for the same period increased by 589.000 to 2,751,236 shares from 2,165,648 shares. It is worth noting that ticker’s short interest has spiked by 2.6M shares, or 71.82%, from the 4/15/2014 settlement date.
Based on the latest AVM, the days-to-cover ratio — a metric that includes both the total shares short and the average daily volume of shares traded — is currently 2.32 days. Days-to-cover for LNKD increased fractionally to 2.32 for the August 15 settlement date, as compared to 2.49 days at the July 31 report.
LinkedIn Corporation has a beta of 1.42 and a short float of 3.70%. In the past 52 weeks, shares of the Mountain View, California-based company have traded between a low of $136.02 and a high of $257.56 and are now at $229.63. Shares are down 9.32% year-over-year ; up 5.9% year-to-date.
The chart below shows where the equity has traded over the last year, with the 50-day and 200-day moving averages included.
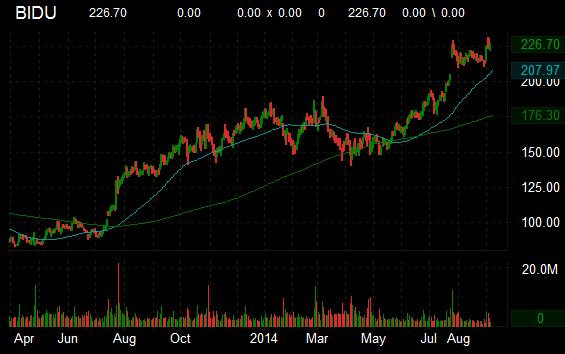
Recent short interest data for the 8/15/2014 settlement date shows a decrease in short interest for shares of Baidu, Inc. (BIDU). As of August 15, the short interest for the Chinese language search platform totaled 5,487,548 shares, as compared to 5,605,637 shares since July 31, a decline of -2.11 %. Average daily volume [AVM] for the same period fell by 2.03M to 2,627,477 shares from 4,659,991 shares. It is worth noting that ticker’s short interest has jumped by more than 2.85M shares, or 108.07%, from the 2/28/20144 settlement date.
Based on the latest AVM, the days-to-cover ratio — a metric that includes both the total shares short and the average daily volume of shares traded — is currently 2.08 days. Days-to-cover for BIDU increased to 2.08 for the August 15 settlement date, as compared to 1.20 days at the July 31 report.
Baidu has a beta of 2.47 and a short float of 1.97%. In the past 52 weeks, shares of the Beijing, China-based company have traded between a low of $134.40 and a high of $231.40 and are now at $226.70. Shares are up 67.10% year-over-year and 27.45% year-to-date.
The chart below shows where the equity has traded over the last year, with the 50-day and 200-day moving averages included.
Leave a Reply