Tyler Cowen has a new book out, called The Great Stagnation. It is reviewed by anti-immigration pundit Steve Sailer.
Cowen and Sailer make a familiar argument, which is that while the rich are getting richer, ordinary Americans have experienced no improvement in their standard of living since 1973, and perhaps even a detritions (1973 is used because that was the height of the post-war boom).
Sailer in particular argues that while entertainment and plastic toys have become cheaper, the things that provide deep life satisfaction for the middle and working classes have become more expensive. This includes a nice home in a safe neighborhood and college for your children.
It is common for free-market economists to dismiss this line of reasoning. I don’t want to do that, so let me note from the beginning that:
- While technological change, unskilled immigration and trade/outsourcing have helped the upper half, they have likely hurt working class Americans.
- The standard of living was improving rapidly for all between 1946-1973, whereas 1973-2008 at best provided slow and uneven improvement.
- When measuring standard of living, it’s not enough to look at the price of consumer products such as laptops. The cost of keeping yourself and your children socially in the middle class – for example sending them to college or even having a stay at home mother – should be included.
However, I disagree with the claim that things are worse than 1973. This is based on relying on one data-set, which is the median hourly wage for non-supervisory production workers as measured by BLS, inflation adjusted by the CPI. But these wages for in total account for less than 40% of national income, and CPI-adjustment is not perfect.
Other data-series tell us a less pessimistic story.
Adjusting for inflation, the Census Bureau measure of median household income increased by 10% between 1973-2008. This is a broader and in my view better measure of income than BLS wages.
Contrary to popular perception, aggregate hours worked per adult are no higher than in 1973. Furthermore, this comparison does not take into account changing demographics. Compared to 1973, America has taken in millions of unskilled Hispanic workers, who earn less and depress the median. If we look at non-Hispanic white households, real median income increased by 15%. For African Americans, real median household income increased by 22%.
Sailer, liberals and paleo-conservatives are convinced that the CPI under-estimates inflation (so that using CPI over-estimates growth). However the Boskin Commission which studied the CPI carefully concluded that the CPI massively over-estimates inflation (and thus leads to underestimation of growth). This is because CPI cannot fully measure technology driven quality improvement, the value of completely new products, and cheaper outlets such as Wal-Mart.
Here is one area where I am not willing to back off even one inch from economist-conventional wisdom. On inflation of consumer goods, Boskin is right and Sailer is wrong.
Another data point is the Survey of Consumer Finance, which measures wealth. Real Median household wealth was $40.000 in 1970 and $88.000 in 2009 (after the crash).
You might argue that it is becoming cheaper to buy “stuff”, but more expensive to buy truly “important things” like housing, health care, education for your children, and that the latter matters more for your well-being than I-pods. But people still spend a huge share of their income on “stuff”, before they spend on “important things”. Here I rely on The Consumer Expenditure Survey. Unfortunately it doesn’t go back to 1973, so I will use the last available comparable year, 1984.
I will look at the middle 20% of the population. One result that jumps at you is that the middle class now pays much lower taxes, taxes are down by about $2.000 per household.
Let’s define “stuff” as food, clothing and services, transportation, utilities, fuels, and public services, household furnishings and equipment, housekeeping supplies, personal care products and services and entertainment.
The price these has decreased, and the quality improved. In 1984 “stuff” was 62% of expenditure, compared to 52% in 2009. In absolute numbers, it declined from $25.000 to $21.000. Of course $21.000 in real dollars today for instance buys you a better car than in 1973.
Expenditure on “important things”, which is housing, health care and education, increased from 37% to 45%. In absolute numbers it went from $15.000 to $18.000. This underestimates the increase, because employer provided health care is also paid through forgone wages. Still, since people spend such a large share of income on it, you can’t just dismiss “stuff” when discussing the quality of life. Even if you believe that it is unimportant, reduced cost of “stuff” means people can more money over to spend on the things they truly care about.
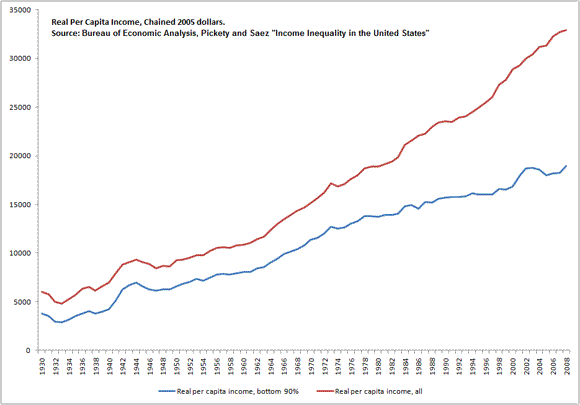
I have also calculated my preferred comparison of income between 1973 and 2008. This relies on measures of aggregate personal income from National Account, calculated by the Bureau of Economic Analysis. These figures have a broader definition of income (I believe the broadest available), and a different inflation adjustment.
I have used measures of the share of national income that goes to the rich from Saez and Pickety. The ten percent richest were those who, in real dollars, earned more than $86,000 in 1973 and more than $112,000 in 2008. I remove the share of income that goes to the ten percent who make more than this. I call the remaining 90% of the population “Lower and Middle classes”.
Per capita national income closely follows the rate of GDP growth. Between 1946-1973, overall per capita income increased by 2.4% annually, and 2.6% for the Lower and Middle classes.
Between 1973-2008 the overall per capita income increased by 1.9% per year. This confirms that Tyler Cowen is right about lower growth rate than the Post-War Golden Age, but also that people who suggest zero growth are wrong. However inequality increased during these years, so the per capita income of the Lower and Middle classes only increased by 1.1% per year. Still, 1.1% is not zero, per capita personal income of the Lower and Middle classes is one and a half time higher compared to 1973, adjusted for inflation.
Lastly Sailer anecdotally discusses the cost of going to college and buying a home when he was young.
The Median home in 2010 dollars went from $160.000 in the 1970s to $221.000 in 2010. This does not guarantee that the quality is the same, but overall prices have only increased somewhat.
I looked up the cost of higher education from the College Board.
In 1980, Full Tuition plus Room and Board cost $14,700 in Private College and $6,700 in public college (in 2010 dollars). In 2010, the figures were $37,000 and $16,100. For my non-American readers it could be important to keep in mind that most students don’t pay full tuition, that this does not include all the public subsidies for higher education, and that two thirds of Americans go to public universities.
So if you have two kids, and send one to public and one to private school, and pay for everything in undergraduate (they will borrow for graduate school themselves), the real cost went from $86.000 in 1980 to $213.000 in 2010. If we add the increase of the cost of a median house, this is close to $200.000 more a middle class family has to pay to stay in the same place they were four decades ago. Or force their children to do what I did, borrow yourself for your own cost of education.
I find a mixed picture, but also pretty strong arguments that “ordinary people are worse off than 1973” is not quite true. In particular, I want to warn people that the BLS median hourly wage figure is not the only measure of income, and likely not the best. It would be more fair to say that ordinary people are worse off compared to what they had a right to expect. They are perhaps also worse off compared to what alternative economic policies would have resulted in, most obvious being a high-wage policy which limits unskilled immigration.
- Bulenox: Get 45% to 91% OFF ... Use Discount Code: UNO
- Risk Our Money Not Yours | Get 50% to 90% OFF ... Use Discount Code: MMBVBKSM
Disclaimer: This page contains affiliate links. If you choose to make a purchase after clicking a link, we may receive a commission at no additional cost to you. Thank you for your support!


Leave a Reply