Since the 1970s, income growth for middle-class American households has become decoupled from growth of the economy. The chart below offers one way to see this. It shows trends in GDP per capita and median family income, with each series displayed as an index set to equal 1 in the initial year. From the late 1940s through the mid-to-late 1970s, the two moved in lockstep. After that, GDP per capita continued its steady upward march (through 2007), but median income rose much less rapidly.
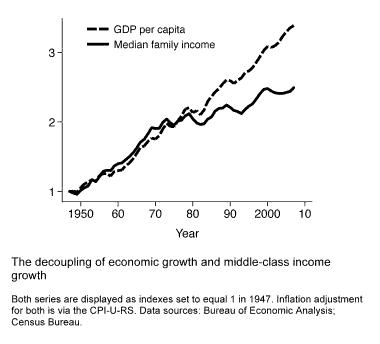
This is disappointing, but seemingly not surprising. After all, income inequality increased sharply during these years. The share of income going to the top 1% of households jumped from 8% in 1979 to 17% in 2007. With a larger and larger portion of economic growth going to those at the top, a divorce between growth of the economy and growth of middle-class incomes is exactly what we would expect to see.
But according to some (here, here, here, here), this picture may significantly overstate the degree of decoupling.
One objection is that the price deflator typically used to adjust GDP per capita for inflation differs from the deflator used for median family income. I’ve addressed that here by using the same deflator for both.
A second concern has to do with GDP per capita as an indicator of economic advance. Since the 1970s a larger portion of GDP has gone to replace old capital equipment and therefore can’t go to household income. Also, the number of persons has increased less rapidly than the number of households, so a per capita (per person) measure of GDP could mislead.
A third worry is that the income measure used to calculate median family income is too thin. If a growing portion of GDP has gone to employer benefits, that would help middle-class households, but it wouldn’t show up in these income data.
To address these second and third concerns, we can turn to a more encompassing measure of household income. The data are from the Congressional Budget Office (CBO). The measure includes all sources of cash income. It adds in-kind income (employer-paid health insurance premiums, food stamps, Medicare and Medicaid benefits), employee contributions to 401(k) retirement plans, and employer-paid payroll taxes. Tax payments are subtracted.
We can use average household income in these data as a substitute for GDP per capita. The CBO data set doesn’t tell us the median income, but it provides something quite similar: the average income of households in the middle quintile of the distribution (from the 40th percentile to the 60th). The following chart adds these two series. The story is virtually identical.
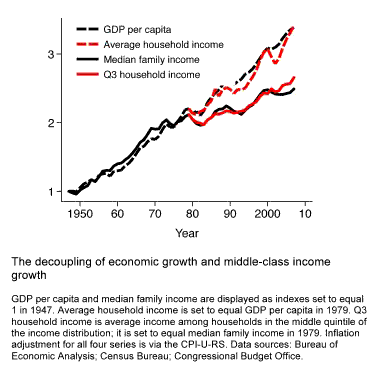
Decoupling is real and sizable.

Leave a Reply