HotPads.com, a national housing search engine, released today its comprehensive Spring Housing Report. The data looks at broad yearly data (since April 2010) and recent developments in Q1. HotPads uses a sample of one million concurrently active rental prices and four million concurrently active for sale prices to provide a detailed overview of what’s going on in the housing market. Here is what they found:
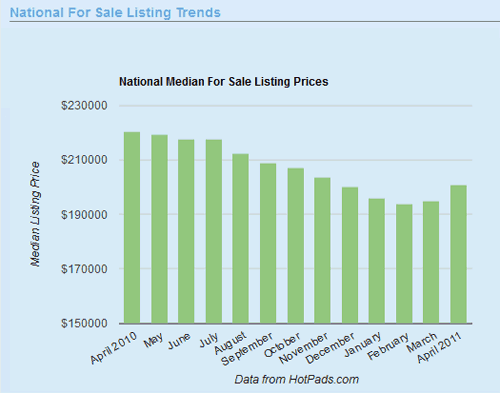
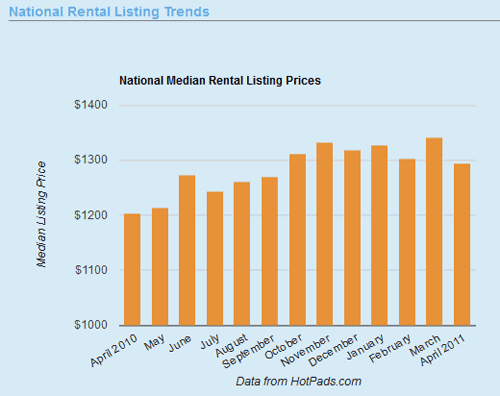
- Yearly rental listing prices are up 7.4% and for sale listing prices are down 8.8%.
- Q1 looks slightly different from yearly trend, with rental listing prices actually down 1.8% while for sale prices are up 3.5%. HotPads believes the Q1 reversal may be part of a seasonal pattern and not necessarily indicative of a broader trend.
- Increasing demand for rental properties is an indicator of a growing preference for low-risk housing options, which is closely linked to the broader economic uncertainty.
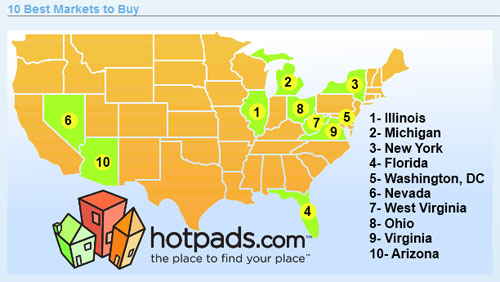
- Rent vs Buy Ratio calculations show certain states may be entering a ‘buyers’ market, including Illinois, Michigan, New York, Florida, Washington DC, and others.
- National data was calculated from the average of each state’s monthly median price weighted by the number of listings in that state.
Click here for full report and interactive charts.
- Bulenox: Get 45% to 91% OFF ... Use Discount Code: UNO
- Risk Our Money Not Yours | Get 50% to 90% OFF ... Use Discount Code: MMBVBKSM
Disclaimer: This page contains affiliate links. If you choose to make a purchase after clicking a link, we may receive a commission at no additional cost to you. Thank you for your support!

Leave a Reply