Initial Claims for Unemployment Insurance dropped by 22,000 last week to 391,000 (last week was revised up by 3,000, so one could see it as a 19,000 decline). This was much better than the expected level of 410,000.
The weekly numbers have been very erratic of late. This is a series that tends to be a bit on the flakey side around the holidays, but that effect should now be subsiding, so perhaps this is a more normalized level.
Beneath 400,000 a Key Level
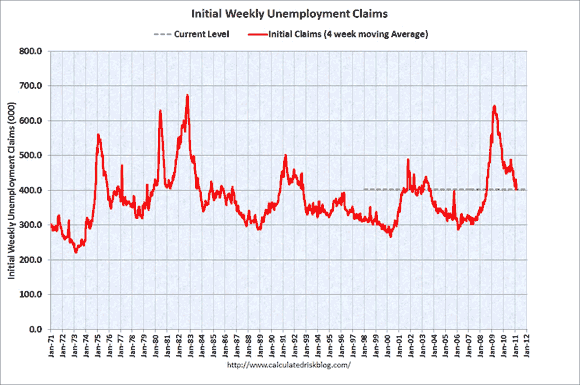
Let us hope the decline continues. If we are below the 400,000 level — and can stay there — it would probably signal the start of robust job growth. While we have had some big upward spikes in recent weeks, the overall downward trend in initial claims seems to be intact. We have gotten out of the “trading range” that initial claims have been in for the last year. Initial claims had been generally trending down since they hit a secondary peak of 504,000 (after revisions) on 8/14.
It seems likely that the harsh winter weather may be playing a role in the erratic behavior. The weather would tend to have more to do with the timing of claims, not the overall level, making the week-to-week numbers more erratic, but not make much of a change in the overall level.
Since claims can be volatile from week to week, it is better to track the four-week moving average to get a better sense of the trend. It fell by 16,500 to 402,000, so it is knocking on the door of the sub-400,000 level. As far as the domestic economy is concerned, robust job creation has been the last big part of the puzzle to fall into place.
Whether it can withstand the pressures from abroad and the increased oil prices is an open question, but right now things are starting to look better on the jobs front. Relative to a year ago, the four-week average is down by 71,500 or 15.1%.
Job Growth Remains Slow
The economy is growing, but not at the sort of rate needed to add a significant number of jobs and to put a dent in the huge army of the unemployed. The January employment report was — to put it politely — full of cross currents. It showed very disappointing job creation on the establishment survey, but the household survey showed a big drop in the unemployment rate to 9.0%.
That was the second month in a row of weak job creation but rapidly falling unemployment. The two-month drop in the unemployment rate was the largest since 1958! That decline was only partially due to a drop in the participation rate (i.e. discouraged people simply giving up and dropping out of the workforce). The actual percentage of people with jobs increased in both months, and the rate of job creation on the household survey (which is generally considered less reliable than the establishment survey, but that does not mean we should disregard the household survey entirely) was extremely robust.
The downward trend in initial claims provides ammunition to the “glass is half full” camp. The graph below charts the path of the four week average (from this source).
Continuing Claims
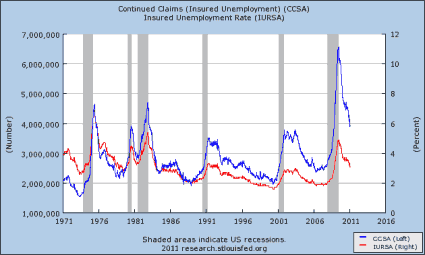
The data on regular continuing claims was encouraging. Regular continuing claims for unemployment insurance fell by 145,000 to 3.790 million. They are down by 1.04 million or 20.9% from a year ago. Regular claims are paid by state governments, and run out after just 26 weeks.
The second graph shows the long-term history of continuing claims for unemployment, as well as the percentage of the covered workforce that is receiving regular state benefits. It does a good job of showing just how nasty that the Great Recession was for the job market.
It also shows how things at the regular state unemployment benefit level have been getting much better over the last year (but still well above the peaks of the last two recessions). Note that the insured unemployment rate generally follows the direction of the number of claims, but has been gradually diverging over time.
That is a function of the overall growth of the labor force, and of tighter eligibility standards for getting unemployment insurance over time. It also reflects the fact that this time around a very large proportion of those getting unemployment benefits are getting them from the extended Federal programs, not from the regular state programs.
In January, half of all the unemployed had been out of work for 21.8 weeks (down from a record high of 25.5 weeks in June), and 43.8% had been out of work for more than 26 weeks. Just for a point of perspective, prior to the Great Recession, the highest the median duration of unemployment had ever reached was 12.3 weeks, near the bottom of the ’82-83 downturn.
Clearly a measure of unemployment that by definition excludes 43.8% of the unemployed paints a very incomplete picture. After the 26 weeks are up, people move over to extended benefits, which are paid for by the Federal government. While regular claims are down, it is in large part due to people aging out of the regular benefits and “graduating” to extended benefits. Unfortunately, the data on extended claims in prior recessions is not available at the St. Louis Fed database.
Even the extended claims have started to trend down, but in an irregular fashion. They (the two largest programs combined) fell by 65,000 to 4.437 million. Relative to a year ago they are down 1.232 million or 21.7%.
How Many Receive Benefits?
A much better measure is the total number of people getting benefits, regardless of which level of government pays for them. Combined, regular claims and extended claims (including a few much smaller programs) fell by 90,000 on the week and are down 2.235 million or 19.6% over the last year.
(The extended claims numbers are not seasonally adjusted, while the initial and continuing claims are, so there is always little bit of apples to oranges. In addition, the continuing claims data are a week behind the initial claims, and extended claims are a week behind the extended claims data. Normally that is not a huge issue, but given the recent volatility it is more significant, especially for the weekly changes).
The recent deal President Obama made with the GOP to extend the Bush tax cuts for all for two years included an extension of unemployment benefits until the end of 2011. People will still “graduate” from the system after 99 weeks, but people will continue to be able to move to the next tier up to the 99 week limit.
Extended benefits are in four different tiers, so if benefits had not been extended, some people would have lost their benefits after just 39 weeks of being out of work. The key point, though, is that the year-long extension does not mean that some people will be getting benefits for a total of 151 weeks, as is sometimes thought.
The tax deal prevented 2 million people from losing this last financial lifeline. The downside to the deal was that it will reverse the downward trend in the budget deficit and cause the deficit to be higher in fiscal 2011 than it was in fiscal 2010, and is now projected to exceed the 2009 record deficit. The extended benefit portion of the deal was not the main reason the deficit is going up, the extension of the high end Bush tax cuts, and particularly the 2% payroll tax holiday played a bigger role.
Some claim that the long duration of unemployment benefits has actually discouraged people from looking for work. That is, people are content to live forever on 60% of their previous income, or $400 per week, whichever is lower. The average benefit is only about $300 a week. Ask yourself, how well could you live on $300 per week?
Right now (well as of the December JOLTS data) there are almost five people out of work for each job opening. Just telling all of them to “get a job” isn’t going to work. The extension of benefits is one of the key reasons that initial claims are falling. While that may sound counter-intuitive, it is because extended benefits are a very effective form of economic stimulus.
It is worth noting that even with the deal there are large numbers of people who are losing their benefits. Those are the 99ers. The 99 weeks of benefits they get works out to be just short of two years.
The heaviest period of lob losses in the Great Recession was two years ago. Many of those people have still not found jobs, and as time goes by they become less and less attractive to employers. The JOLTS report showed that in December there were 3.1 million Job openings, and that month we had 14.5 million people unemployed, so there are 4.67 people unemployed for each job opening.
Extended Benefits = Economic Stimulus
Extended unemployment benefits are, dollar of dollar, one of the most effective forms of economic stimulus there is. It is a pretty good bet that the people losing their extended benefits have depleted their savings and run up all the debt they can in trying to make ends meet. The maximum unemployment benefit works out to be just $20,800 per year, or less than the poverty line for a family of four. You think any of those people have been able to sock any of that away?
There is a concern that by cushioning the blow of unemployment, people might be more reluctant to take a marginal job opportunity, but a below poverty level income is not that much of a cushion. I’m not sure it is good for the economy for highly skilled people to be taking jobs in other fields that have no use of those skills, and then be unavailable when those skills are needed again.
The people who get extended benefits tend to spend the money quickly on basic needs. This, in turn, keeps customers coming in the door at Wal-Mart (WMT) and Family Dollar (FDO). It means that, at the margin, some people are able to continue to pay their mortgages and thus helps keep the foreclosure crisis from getting even worse than it already is.
However, by the time they are well into extended benefits, they might also be spending food stamps as well as the unemployment check at Kroger’s (KR). These customers keep the people at Wal-Mart, Family Dollar and Kroger’s — and of course their competitors — employed. It also keeps the people who make and transport those goods employed as well, although in that case much of the stimulus is lost overseas if the goods are imported.
However it is not clear if the marginal propensity to import is higher for poor (or temporarily poor because they are unemployed) or for the rich. Lots of the stuff on the shelves of Wal-Mart comes from China. On the other hand, the poor are not likely to be buying Swiss watches or German autos. They will not be buying absolutely frivolous things like water imported from halfway around the world (Fiji water).
What is clear is that they will spend it quicker, increasing the velocity of money, than will the rich who will tend to save more of it, particularly if they see the increased income from say a continued tax cut for the highest income people as temporary. The rich are much more likely, in other words, to fit Milton Friedman’s “Permanent Income Hypothesis” than are the unemployed, since the rich do not face liquidity constraints.
Also, if you remember your Friedman, velocity of money counts, and it counts a great deal. P * Q = M * V. Price times quantity in the aggregate is nominal GDP, and it is equal to the amount of money in circulation times how quickly it changes hands. Money in the hands of the unemployed has a much higher velocity than money in the hands of a multi-millionaire.
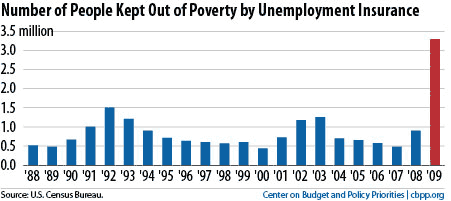
In addition to being a good source of economic stimulus, and thus benefiting those that are still employed, there is the obvious benefit to those who get the benefits. While we don’t want unemployment insurance to become a back door form of welfare and all the dependency issues that raises, unemployment benefits help keep people out of poverty, especially in a deep recession. In 2009, it helped keep 3.4 million people out of poverty, up from 900,000 in 2008, and under 500,000 in 2007.
This is shown in the graph below (from http://www.cbpp.org). Presumably the number will be just as large for 2010 as it was for 2009.
There really is no good way to tell from this report if the decline in the number of people receiving benefits is due to them getting new jobs, or due to even the extended benefits running out. If it is the former, it is very good news. If it is the latter, it just means more people are falling into absolute destitution. That is not good news for either the economy or for social stability.
Both the very high unemployment duration numbers and the falling civilian participation rate (it fell to 64.2% in January from 64.3% in December, would suggest that it is the unhappy later case that is happening.
The longer-term trend is very much in the right direction. These numbers are still being affected by the bad weather we have been having, so the numbers will have to be watched closely over the next few weeks. We really need to see the 4-week average fall below the 400,000 level and stay there is we are going to climb the Stairway to Heaven of a rapidly falling unemployment rate. If it shoots above 500,000 then we are on the Highway to Hell. The current level, provides a hope that we have escaped the purgatory of a pseudo recovery, and are about to climb that stairway.
I would like to see a few more weeks of continued improvement, or even stabilization at the current weekly level before declaring victory, but right now there are still very real reasons for optimism.
FAMILY DOLLAR (FDO): Free Stock Analysis Report
- Bulenox: Get 45% to 91% OFF ... Use Discount Code: UNO
- Risk Our Money Not Yours | Get 50% to 90% OFF ... Use Discount Code: MMBVBKSM
Disclaimer: This page contains affiliate links. If you choose to make a purchase after clicking a link, we may receive a commission at no additional cost to you. Thank you for your support!

Honestly, who believes these effing statistics? These media whores just keep whipping up the same stupid unbelievable B.S.
Excellent excellent summary of the unemployment situation in this country. Best i’ve read so far. Thank you. Hopefully our legislators will read as well.
Another misleading shameful story that indicates the number of those registering for unemployment have dropped. Because those over 99 weeks or those that have exhausted benefits are not fully counted. They are just forgotten! Count them in and you will have the real unemployment count. Also we need to do without the Tier confusion. Most Americans think Decembers unemployment extension bill signed by Obama will cover all of the unemployed through 2011. (This blatant lie skillfully smoothed over in this article.)
Also pay attention to the way other information was gathered. In the 8th paragraph it mentions a “household survey (which is generally considered less reliable than the establishment survey)”. Both of these surveys are conducted at random sometimes by phone and that does not indicate if the person answering the call is employed or unemployed. Quite a few 99ers and other unemployed have no phones or permanent addresses to contact them! So who exactly who are they surveying?
I love the way these passive, pro “the economy is getting better” articles use the polite phrase “People will still “graduate” from the system after 99 weeks”. Instead of the phrase “People are still being dumped” from the system after 99 weeks, since April 2010 with no help provided. However almost a year later we are told by the Vice President to “HANG IN THERE”.
We are being told our government is broke. While at the same time we are helping to rebuild Iraq and Afghanistan. (which hates Americans!) We even send money to Egypt and other troubled countries!
Do unemployed Americans that have exhausted all benefits have to start rioting and throwing rocks in the streets to get some recognition.