In the course of preparing for my discussion of Rob Shimer’s paper (see my post here), I had my RA (the tireless Constanza Liborio) dig up some aggregate wage data for the U.S. economy. Let me preface the discussion that follows by saying that I am wary of putting too much stock in aggregate wage data (the composition bias, in particular, is potentially a big problem; see here). O.K., with this caveat in mind, let’s take a look at some data.
As a measure of real wages, I use the BLS Employment Cost Index. Evidently, this measure is preferred by the likes of Bob Hall and others because it includes non-wage benefits. In what follows, I examine quarterly data for the sample period 1990:1 – 2010:3. The following chart plots the (annualized) rate of growth in nominal wages. The red line is a five-quarter rolling window I use to smooth out the series. The shaded areas represent NBER recession dates.
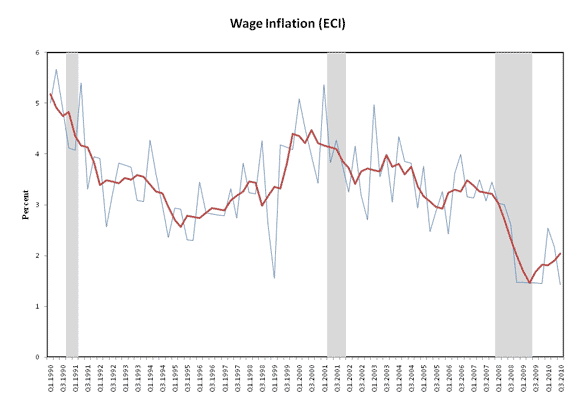
Prior to the most recent recession, nominal wages grew on average by about 3.5% per annum. The data shows a significant deceleration in nominal wage growth during the last recession. The composition bias suggests that actual wage growth displayed even greater “flexibility,” as unemployment is typically concentrated among lower wage workers.
As I want to construct a measure of real wages, I need some measure of inflation. To this end, I use the GDP deflator, which is plotted in the next diagram.
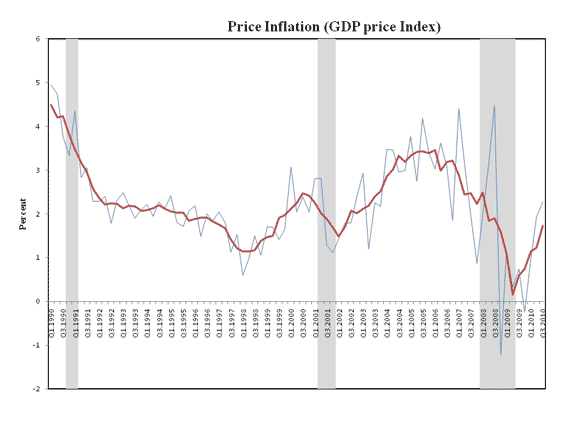
Prior to the most recent recession, this measure of inflation averaged just above 2% per annum (the Fed’s implicit inflation target). There was, however, a notable run up in the early 2000s, with (trend) inflation peaking at just over 3% in 2005 and early 2006. It is interesting to note that the rise in inflation over this period occurred while nominal wage growth decelerated. The next diagram plots the growth rate in real wages.
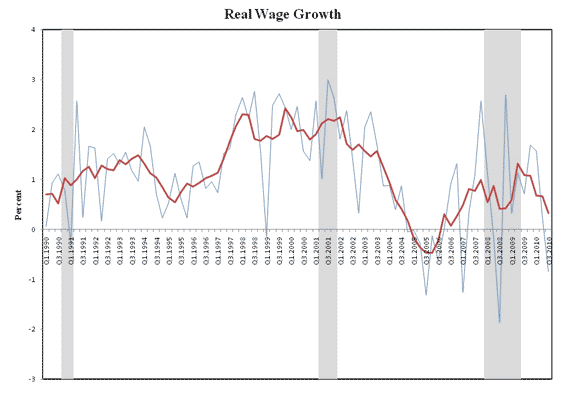
Now, the focus of Shimer’s paper was apparent “ridigity” in real wage growth during the recent recession; a development that he interpreted as explaining the recent anemic behavior in employer recruiting intensity. As for myself, I was rather struck by the rapid deceleration in real wage growth in 2004, leading to falling real wages in 2005.
I want to take this data at face value for the moment and speculate a bit on what role these wage developments may have had in bursting of the U.S. home price “bubble” in 2006.
The story I have in my head revolves around an idea I first saw exposited by Joseph Zeira in his fine (and much under appreciated) paper: Informational overshooting, booms, and crashes.
The basic idea in Zeira’s paper is as follows. Imagine an asset whose dividend grows a H% per year. Everyone knows that this growth will one day come to an end. When this date arrives, the dividend grows at L% per year forever (a simplifying assumption), where L < H. The only uncertainty in this thought experiment pertains to the date of the “regime change.”
Zeira demonstrates that the equilibrium (rational expectations) asset price rises over time, and continues to rise as long as dividend (read: real wage) growth expectations continue to be met. Then comes the shock. I am tempted to call this a Wile E. Coyote moment, but of course, everyone in this model–unlike that hapless desert dog–knows that there is a date of reckoning. They just don’t know beforehand when it will happen. So what happens?
Naturally, the asset price plummets like stone cast from heaven, before settling down along its new “fundamental” value (reflecting a new era of diminished expectations…gosh, I’m sounding a lot like PK these days). It appears as if asset prices “overshoot” their long-run fundamental value, before crashing.
To an outside observer, the asset price dynamics just described may be interpreted as a typical “irrational” boom and bust cycle (perhaps justifying some form of financial market regulation). In the context of the model world just described, this interpretation is completely wrong. This type of boom bust dynamic is, in fact, the natural consequence of how information is priced in an efficient asset market.
The picture I have in my head then is the following. Real wage growth appears relatively robust over the late 1990s and early 2000s. The return to labor, perhaps more than any other variable, measures the capacity for the average household to service debt. In the first half of the 2000s, creditors are looking at a recent history of relatively robust real wage growth, justifying credit expansion (even into subprime). By 2005, however, evidence of flagging fundamentals (anemic real wage growth) led to a (rational) revision downward in the real wage growth regime. Credit supply and real estate prices soon began to reflect this change in economic fundamentals.
Anyway, that’s my crazy idea for the day. Feel free to share your thoughts…

Leave a Reply