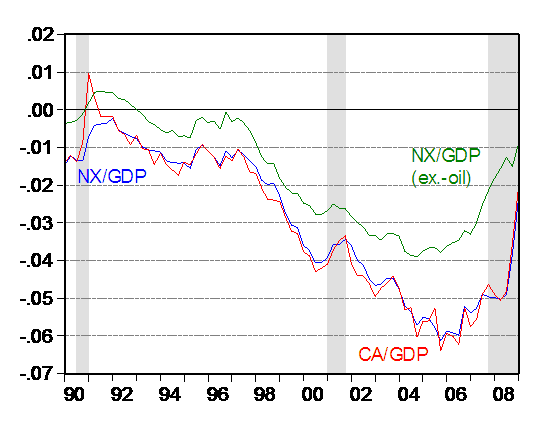
It’s not news that the US current account, trade balance and trade balance ex.-oil are all moving toward zero percentage points of GDP. As I’ve observed before, time will tell how much of this movement is durable (see Bertaut, Kamin and Thomas for skeptical look; see also Cline-Williamson); this in turn depends on whether the adjustment reflects standard macro effects, including a permanent downshift in US consumption growth [0], and how much reflects perhaps transitory effects like a credit crunch in trade financing (as speculated upon here). Here’s the trade balance situation for the US.

Figure 1: Net exports to GDP (blue), net exports ex.-oil to GDP (green), and current account to GDP (green). NBER defined recession dates shaded gray; assumes current recession has not ended by 2009Q1. Source: BEA, 2009Q1 GDP preliminary release (28 May 2009), NBER, and author’s calculations.
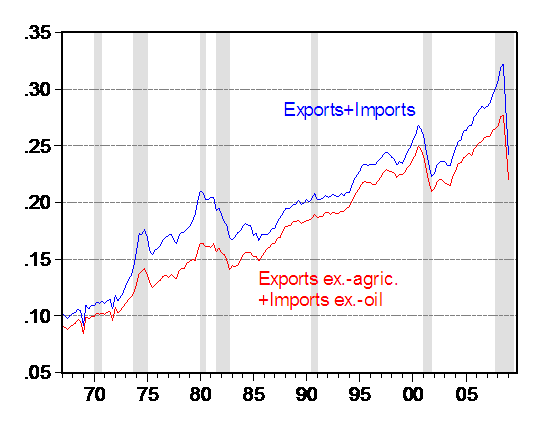
The trade balance — the difference between exports and imports — obscures the overall trend in both inflows and outflows of goods. What’s of interest is whether the process of deglobalization, first discussed in this post from two and a half years ago (updated here), continues. At that time, oil prices seemed to be critical. Now, it seems that financial issues are at play. Here’s one de facto measure of trade openness, the sum of exports and imports normalized by GDP (as well as exports-ex. agriculture plus imports ex.-oil).

Figure 2: Sum of exports and imports divided by GDP (blue), sum of exports ex.-agricultural goods and imports ex.-oil divided by GDP (red). NBER defined recession dates shaded gray; assumes current recession has not ended by 2009Q1. Source: BEA, 2009Q1 GDP preliminary release (28 May 2009), NBER, and author’s calculations.
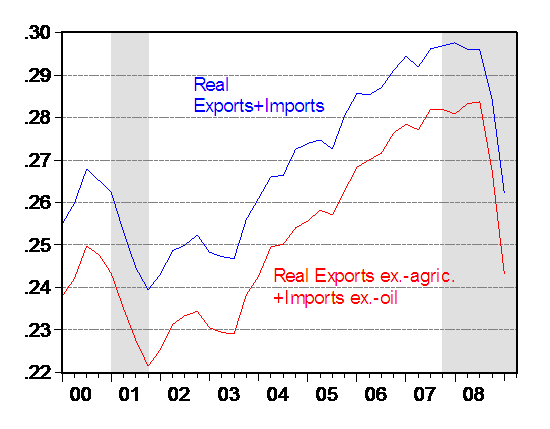
What’s clear is nominal trade flows drop during recessions, and tend to resume growth later in recoveries. These shares though incorporate both price and volume changes, so Figure 2 is not a clean measure of trade openness. An alternative is to use “real” measures. Figure 3 presents real trade normalized by real GDP over a shorter period.

Figure 3: Sum of real exports and real imports divided by real GDP (blue), sum of real exports ex.-agricultural goods and real imports ex.-oil divided by real GDP (red). Real series in Ch.2000$. NBER defined recession dates shaded gray; assumes current recession has not ended by 2009Q1. Source: BEA, 2009Q1 GDP preliminary release (28 May 2009), NBER, and author’s calculations.
I will observe that it is not quite kosher to add and divide Chain weighed series. However, a similar pattern is observed if one uses geometric averages instead of arithmetic averages [1].
Using real values tends to shave off the top of the peak ratios in 2008, but the basic fact remains that trade openness has dropped off precipitously.
So, the critical questions for determining future directions in trade openness include:
- Will the supply of trade financing become normalized?
- Will oil prices trend upwards again? And will this cost induce increases in shipping costs, even as oversupply of shipping services tend to depress them?
- Will US consumption continue to stagnate? (See this brief article by Glick and Lansing).
- Will protectionist measures (such as Buy American provisions) be expanded?
DeGlobalization: Transitory or Persistent?
- Bulenox: Get 45% to 91% OFF ... Use Discount Code: UNO
- Risk Our Money Not Yours | Get 50% to 90% OFF ... Use Discount Code: MMBVBKSM
Disclaimer: This page contains affiliate links. If you choose to make a purchase after clicking a link, we may receive a commission at no additional cost to you. Thank you for your support!


Leave a Reply