The Consumer Price Index (CPI) rose by just 0.1% in September, down from increases of 0.3% in August and July. Year over year it is up just 1.1%.
Almost all of the increase was due to energy prices, which rose 0.7% after increases of 2.3% in August and a 2.6% increase in July. Year over year, energy prices are up 3.8%. Actually, the increase is even narrower than that, as energy commodities such as gasoline were up 1.8% in September — a sharp deceleration from the 3.8% increase in August and the 4.0% rise in July, but still much higher than inflation in the rest of the economy.
Energy service prices, like electricity and piped gas services, actually fell by 0.8%. In August, these increased just 0.4% after being up 0.8% in July. Food prices were relatively well behaved, rising 0.3% for September up from 0.2% in August, but after falling 0.1% in July. Year over year, food prices are up 1.4%. Due to poor harvests in several important areas of the world, most notably due to droughts in Russia and floods in Pakistan, agricultural commodity prices have been rising sharply in recent weeks, but so far they have had relatively little impact on Consumers shopping at Kroger’s (KR).
The trend, though, suggests that the impact is starting to be felt. Still, the actual cost of raw wheat is a very small fraction of the actual cost of a loaf of bread, so one would not want to exaggerate the likely impact of higher prices in the Commodity pits on prices at the checkout counter.
Core Inflation
Thus, if one strips out the volatile food and energy prices to get to core inflation, prices were unchanged in both September and August, down from a 0.1% increase in July. Year over year, core prices are up 0.8%. Over the last three months, the increase annualizes to just 0.4%. While everyone consumes food and energy, their prices tend to be extremely volatile, and can be influenced by external events.
As such, the Fed tends to focus more on core prices when setting monetary policy. After all, it would not be a good idea to be tightening up on the money supply or raising interest rates simply because there is a drought in a key agricultural area of the world which drives up food prices, or because there is instability in the Middle East which causes energy prices to rise. Together, food and energy make up just 22.3% of the total CPI.
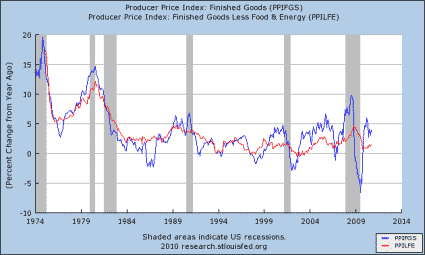
The graph below tracks the long-term history of the CPI (year-over-year change) on both a headline and a core basis. Note that core CPI is at an all-time low for the period on the graph (and I cut out the really high inflation 1970’s so you could get a better sense of the more recent movements). The year-over-year change in core CPI is at levels last seen in the early 1960’s. If the pace of the last three month were to be maintained for a full year, it would be an all-time low.
Owner’s Equivalent Rent (OER)
The key reason why the core CPI has been so low of late is the cost of shelter. Housing prices are not measured directly through a housing price index like the Case-Schiller index. Instead, the government tries to measure just how much it would cost you to rent a house equivalent to the house you own next door to it.
This is known as Owner’s Equivalent Rent (OER). It makes up 25.21% of the CPI, or more than food and energy combined. Regular rent, paid by tenants to landlords, makes up another 5.97% of the overall CPI. The two rent measures tend to move closely together and combined make up 31.2% of the overall CPI, and since you neither eat nor burn your house (unless you are an arsonist committing insurance fraud) they make up an even larger part of the core CPI, 40.1%.
Regular rent rose just 0.1%, reversing a 0.1% decline in August, after increases of just 0.1% in each of July and June. Over the last year it is up just 0.2%. OER was unchanged on the month after also being up just 0.1% in August, and unchanged in July, and is down 0.1% over the last year.
The use of OER rather than directly tracking housing prices makes for a much more stable CPI. If housing prices were directly measured, so using the Case-Schiller index, inflation early in the decade would have been running at levels close to what we saw in the 1970’s — over the past few years as the housing bubble burst, we would be experiencing severe outright deflation in the core CPI.
Ward Off Deflation
Deflation is a very nasty beast, and one that the Fed must stop from emerging at all costs. At any given level it is far more insidious than inflation, we can and have done reasonably well as an economy with 3 or 4% inflation, but 3 or 4% annual deflation would be an economic nightmare. For starters, nominal interest rates do not go below 0.0%, which means that real interest rates rise sharply. That will choke off capital investment in the economy.
At the same time, if people know that prices are going to be lower in the future than they are now, they will sit on their wallets. Total demand will fall. With no customers since they are all sitting and waiting for prices to go down, businesses will have even less reason to invest and will have need for fewer employees. The resulting layoffs will result in still less aggregate demand. Lather, Rinse, Repeat.
Right now, the risk of deflation is greater than the risk of run away inflation. This report, does little to alleviate those fears, although the somewhat hotter than expected PPI yesterday did help a bit (see “PPI Up 0.4%, Core Up 0.1%“). We are not in it yet, at least as measured by core prices, but we are uncomfortably close.
The threat of deflation is one of the reasons that long-term T-note yields are so low. A return of under 2.5% per year is not very enticing for locking up your money for ten years. If inflation were to average over the next ten years, what it has averaged over the last ten years (2.5%) the increased amount of goods and services you could get for delaying your gratification for a decade would be nothing. If it were to average what it has since 1984 (the period covered by the graph above, 3.0% for both core and headline) you would actually lose purchasing power by locking up your money.
At the first hint that inflation is picking up, bond yields can be expected to head much higher. Even though I think that deflation is a greater threat right now than a return to the high inflation of the 1970’s, I do not think that the Fed will allow it to happen. Deflation is the only scenario under which the purchase of long-term treasuries makes sense at these levels. To buy a T-note, you have to be rooting for breadlines and Hoovervilles.
A good way to bet on T-note yields rising is the Short Treasury ETF (TBT). To make sure it does not happen, the Fed now seems very likely to embark on a second round of Quantitative Easing (a.k.a. QE2). Most likely they will announce a program where they are buying about $100 billion of longer term T-notes per month at their next meeting on November 3.
Where the Growth Exists
So what areas are showing price increases? Health Care costs always seem to run faster than overall inflation, but even they seem relatively well behaved. Medical commodity prices (i.e. drugs) were up 0.3% in September, after rising 0.2% in August, but that simply reversed a 0.2% decline in July and came after they were unchanged in June. While year over year they were up 2.6%, if the pace of the last three months were sustained, there would be just 1.2% inflation in the price of medical commodities.
Part of the reason for that is probably the increasing substitution of generic drugs for name brand prescriptions. While the drugs are still on patent, firms like Pfizer (PFE) and Merck (MRK) are still aggressively raising prices, but they are now losing share to their slightly older drugs that are no longer state enforced monopolies and have to face the free market.
Medical Services prices (i.e. a visit to the hospital), on the other hand, jumped 0.8% in September, way up from the 0.2% rise in August after being unchanged in July. Year over year, medical service prices are up 3.7%, but if the last three month pace were maintained, they would be up 4.1%.
The taming of medical inflation is vitally important, as rapidly rising health care costs are the primary factor in the long-term structural budget deficit. It is the long-term structural deficit that we have to be worried about, not the current big deficit that is mostly due to cyclical factors (reduction in tax revenues and higher automatic stabilizer costs due to high unemployment).
The other noteworthy area of inflation is in car prices, particularly used car prices. That finally changed for the better in September, as they fell 0.7%. On the other hand, in August, the price of a used car rose 0.7%, and that is on the heels of a 0.8% increase in July and a 0.9% increase in June. Hey, the trend is in the right direction. Still, we are talking about a 12.9% rise over the last year.
In contrast, the price of new cars rose just 0.1% in September, down from a 0.3% rise in August and after back-to-back increases of 0.1% in June and July. Year over year, new car prices are up 2.1%. While that is still more than the overall rate of inflation, which indicates more pricing power on the part of Ford (F) than the average company has, it pales in comparison to the jump in used car prices. The differential seems obviously unsustainable to me, but yet it persists month after month. That is probably good news for the big used car dealers like CarMax (KMX).
However, if it were to continue for a few more years, a 1999 Ford Escort would cost more than a new Ford Focus. Somehow I don’t see that happening, and the September drop probably signals the end of this sharp rise in used car prices. What we are probably seeing is a large “inferior good” effect. In other words, in tough times people gravitate to buying the cheaper product, even if is of inferior quality. Used cars relative to new cars meet that description.
Our Take
Overall, this was a fairly solid report. It does not totally put to bed the danger of deflation, but it does not further fan the worries of it. It certainly does not raise the specter of run away inflation any time soon. It will probably be an argument in favor of going ahead with QE2.
QE2 would be bullish for stocks and commodities, a mixed bag for bonds (the additional buying pressure from the Fed would reduce yields, but to the extent that QE2 raises expectations for inflation going forward, long-term yields would tend to rise) and is bearish for the dollar (and thus bullish for other currencies).

Leave a Reply