In March 2001, I was tasked to follow developments in Japanese macro policy (including monetary, exchange rate, and banking recapitalization issues). Readers will be tempted to ask what this has to do with current events. Well, at the time, Japan was facing rapidly rising net debt-to-GDP ratios (rising from 60.4 ppts of GDP to 84.6 ppts from 2000 to 2005), and was embarking upon a policy of quantitative easing in an attempt to stave off a deep recession. And yet opponents of quantitative easing worried about hyper-inflation, even as y/y inflation at the time remained mired in the negative range. I didn’t understand the fears at the time; and I still don’t. Now flash forward eight years, and move across the Pacific.
Recent commentary has focused on the sharp reversal in US long term interest rates [0] and the steepening of the yield curve [1] [2]. The anxiety seems to be centered on the collision between increasing supply and decreasing demand for US government debt (although see Brad Setser’s recent article), combined with quantitative easing that spurs fears of debt monetization. US Federal debt held by the public to GDP ratios are projected to rise from 56.8 ppts to 73.2 ppts (end-FY09 to end-FY14) (Source: CBO, March 2009), while reserves have gone from $96.5 billion in August 2008 to $949.6 billion by April 2009 (seasonally adjusted figures, from FREDII). Of course, returning to my Japan case, reserves (actually, the “current account balance”) rose from about 5 trillion yen to about 32 trillion by 2004 during the episode quantitative easing, before reverting to about 9 trillion in 2006 (Source: Humpage and Schenk, 2009). And yet, Japanese y/y inflation never really stayed in positive territory until 2008 (and it’s back to negative range in 2009Q1).
Hence, I thought it useful at this juncture to review trends in long term nominal interest rates and long term real interest rates, in order to get some perspective.
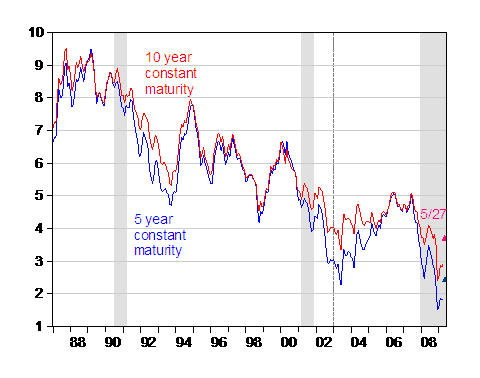
Figure 1: Five year (blue) and ten year (red) constant maturity nominal yields, monthly averages of daily data. Triangles denote data for May 27. NBER defined recession dates shaded gray. Dashed line indicates sample start for Figure 2. Source: FREDII and NBER.
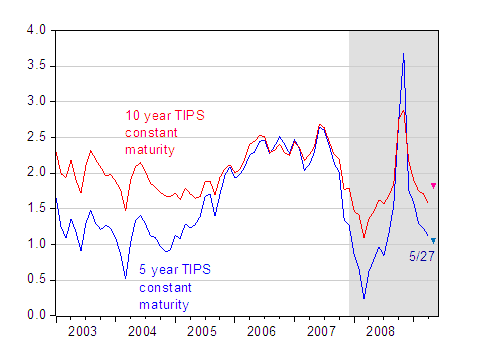
Figure 2: Five year (blue) and ten year (red) TIPS constant maturity yields, monthly averages of daily data. Inverted triangles denote data for May 27. NBER defined recession dates shaded gray. Dashed line indicates sample start for Figure 2. Source: FREDII and NBER.
Ten year constant maturity rates as of 27 May are back to levels of September 2008, as are the real rates (keeping in mind the distortions in the TIPS markets). The sharp rise in the nominal rates, even while real rates are only slightly above where they were in April, suggests to me that about half the nominal interest rate movements are due to revisions to inflation expectations (here’s Jim’s take on the inflation component to these yield shifts).
Taking the Treasury-TIPS spread literally as a measure of inflationary expectation (see caveats in the appendix here), 10 year expected inflation was 1.36% in April; as of May 27, the implied annual inflation was 1.88%, an increase of about 0.5 percentage points. The increase in the 10 year real rate was 0.26 percentage points. Of course, one would want to allow for a lot of uncertainty in these calculations, given the academic research detailing the problems with equating break-even with expected inflation (see D’Amico et al. 2008), even before the recent turmoil in the TIPS markets.
Of course, the United States in 2009 is different than Japan in 2001. One key difference is that Japan was, and remains, a net creditor. America is a big net debtor to the rest of the world, with extremely large holdings of US Treasurys by foreign private and state actors. And so, for me, I worry more about higher real interest rates (portfolio balance effects) than higher inflation. But even here, real yields according to TIPS seems fairly low in historical perspective (and roughly comparable to those prevailing during the period characterized as “the saving glut”).
My bottom line: Think, and recollect, before panicking.
High Anxiety (about Interest and Inflation Rates)
Disclaimer: This page contains affiliate links. If you choose to make a purchase after clicking a link, we may receive a commission at no additional cost to you. Thank you for your support!


Leave a Reply