Initial Claims for Unemployment Insurance remain in the tight “trading range” they have been in since the start of the year. This week they fell by 11,000 to 457,000.
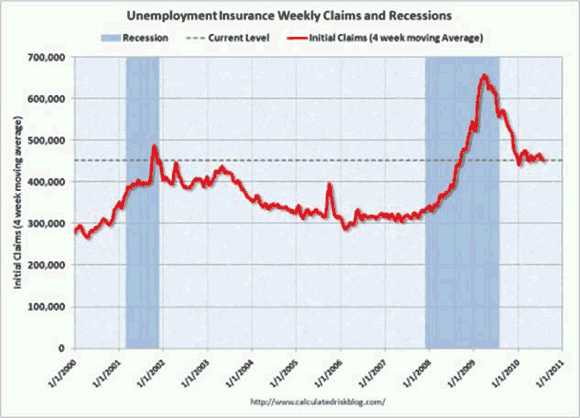
As the graph below shows, great progress was made in reducing initial claims between March of 2009 and the New Year, but since then initial claims have found a high — but bumpy — plateau. There is a fair amount of volatility in the week-to-week numbers, so it makes sense to look at the four-week moving average, which is what is shown in the graph (from http://www.calculatedriskblog.com/).
The four-week average fell by 4,500 to 452,500. This pattern is similar to what happened in the wake of the last two recessions — which were followed by long periods of “jobless recoveries” — but in distinct contrast with the pattern of initial claims coming out of earlier postwar recessions. Then, when claims started to fall, they kept falling until they roughly reached their level prior to the start of the recession.
The decline this week is good news, but given the recent pattern, it seems more likely that it is just noise rather than the start of a sustained downtrend. We really need to see the four-week average fall below the 400,000 level to indicate that we are making serious progress towards reducing the unemployment rate. Without a doubt, we are in better shape than a year ago when the four week average was at 562,750, but more progress needs to be made.
Continuing Claims
While the news on initial claims was mildly encouraging, the news on regular state-based continuing claims was mildly discouraging. Regular continuing claims rose by 81,000 to 4.565 million in the last week. They are released with a one-week lag and are based on claims paid for from the State unemployment insurance funds. These are the claims that run out after 26 weeks.
However, in June, half of all the unemployed had been out of work for 25.5 weeks. Thus regular continuing claims are not a very complete picture of the unemployment situation. After that point, people move on to extended benefits, which are normally provided by the federal government in recessions. However, the data on extended claims is released with a two week lag, and thus is still showing the effects of the Senate delay on extending benefits.
Good News Just on the Surface
So what on the surface looks like good news — a decline of 269,000 to 3.66 million — really is not. Just because someone is kicked off the benefit rolls does not mean he or she has gotten a new job. The reality is that they now simply have no source of income.
By this point, it is highly likely that they have drained all their savings, including IRAs and 401(k)s and thus have no financial resources at all. That is not a situation that is going to make those people want to go out and shop. OK, they might want to go shop, but they have no ability to do so.
That means fewer shoppers at Wal-Mart (WMT) and Big Lots (BIG). They will probably go on food stamps, which will allow them to continue to make the occasional trip to Kroger’s (KR).
Given the extraordinary duration of unemployment in the wake of the Great Recession (the prior peak in the median duration of unemployment was 12.3 weeks, set in December 1983), the best way to look at the continuing claims is the total number of people getting benefits, both regular and continuing. Right now, though, the numbers are being distorted by the time lags in the reporting. An extension of unemployment benefits was able to make it past the Senate filibuster, but the data has not caught up.
Thus this week the total number of people getting benefits shows up as 8.225 million, a decline of 188,000 from last week. That is also 1.200 million, or 12.7%, below a year ago. However, by next week, the people who were thrown off the rolls of extended benefits will start coming back and the total is likely to rise again, perhaps very sharply.
Taken on its own, this report overall is mildly encouraging. However, when one considers the context, it is not really worthy of that much celebration.
KROGER CO (KR): Free Stock Analysis Report
BIG LOTS INC (BIG): Free Stock Analysis Report
WAL-MART STORES (WMT): Free Stock Analysis Report

Leave a Reply