Observers of political survey research are no doubt familiar with the concept of a “bounce,” the lift in polling numbers a presidential nominee tends to get immediately after his (or someday her) party’s national convention. As seen in the two postings immediately below the present one, poll analysts have been examining the immediate “bounce” from President Obama’s health care speech on September 9 with regard to support for his and congressional Democrats’ reform plans.
Bounces tend to dissipate, however, so it’s a good idea to look at polling numbers after additional days have gone by and the “buzz” over a speech has begun to die down. A week post-speech may not seem like sufficient time for assessing the persistence of any gains in support following Obama’s address to Congress. However, with the hour-to-hour news cycles in the political blogosphere and on cable news channels, a week arguably is pretty long.
Another issue is whether any observed shift in aggregate opinion is broad-based, as opposed to being confined to partisans of one type or another. The graph below thus examines these two elements of post-speech public opinion on health care reform: what do things look like with a week’s passage of time, and how do the trends break down by party? The traditional “red/blue” color scheme for self-identified Republicans and Democrats, respectively, is used, with Independents in purple, and overall (full-sample) trends in black. Each poll (Economist/YouGov [pre, post], FOX News, Pew Research Center) is identified by its initial letter. Finally, each dot placement represents that poll’s final day in the field (e.g., the FOX “post” poll was taken September 15-16).
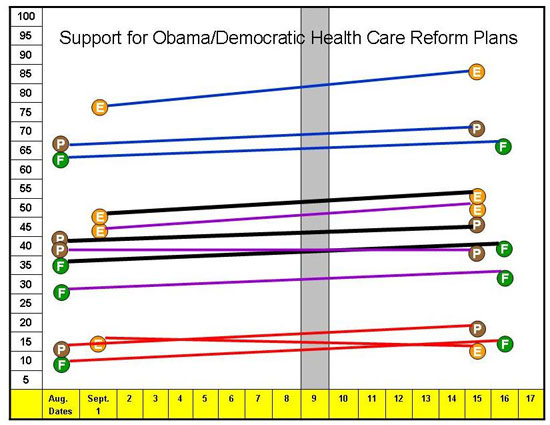
Two trends are apparent in the above graphs. First, there appears to be a small, but consistent upward bump in support for Obama and the Democrats’ reform plans. Second, contrary to some media commentary, small increases in support were observed all partisan subgroups, not just the President’s Democratic base.
A few qualifiers are in order:
1. Just because measured support for the Obama/Democratic reform plans appears to be higher after the speech than before, this doesn’t mean that we can definitively say the speech caused the rise. Other news developments or social/political dynamics potentially could have caused the shift, although I can’t think of any other, more salient explanation than the speech itself.
2. The polls depicted in the graph above are, of course, not the only ones available. For example, Rasmussen’s daily tracking polls (based on two-day rolling averages) have shown support for the Obama/Democratic reform plans rising from 44% immediately before the speech to 51% roughly three days afterwards, but then falling back down to around 44% in the following days.
Disclaimer: This page contains affiliate links. If you choose to make a purchase after clicking a link, we may receive a commission at no additional cost to you. Thank you for your support!

Leave a Reply